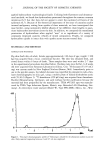
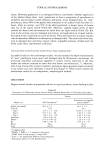
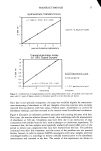
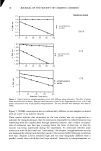
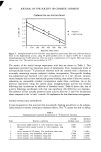
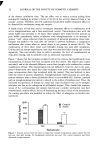
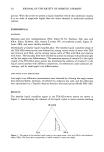
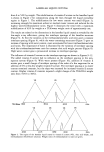
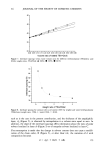
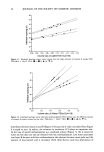
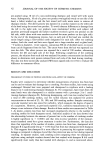
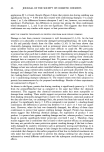
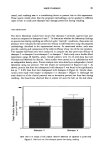
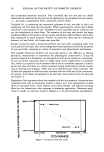
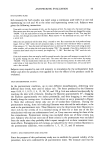
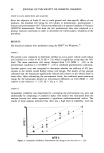
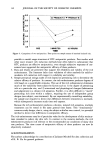
62 JOURNAL OF THE SOCIETY OF COSMETIC CHEMISTS STUDY II: DATA REDUCTION AND ANALYSIS Since the objective of Study II was to track general and time-specific effects of two products, the maximal itch rating for itch subject at pretreatment, posttreatment 1 minute and posttreatment of 0.5 hours was subjected to a repeated Analysis of Variance (ANOVA) measurement. Data from the two pretreatment sites were subjected to a product moment correlation in order to determine the within-subject reliability of the procedure. RESULTS All statistical analyses were performed using the SPSS TM for Windows. TM STUDY I The paired t-test computed to determine whether an oil-in-water vehicle could reduce itch resulted in a t-value of 10.33 (df = 33), which is significant at less than the .001 level. The mean maximum itch rating changed from 5.18 (SEM = .353) in the pretreatment condition to 1.62 (SEM = .213) in combined posttreatment conditions. Another paired t-test was computed to determine whether the addition of 6% ben- zocaine to the vehicle would further reduce itch ratings. The results of this analysis indicated that the benzocaine significantly reduced itch relative to the vehicle alone in intact skin. After subtracting the pretreatment levels, the combined mean maximum rating for the benzocaine showed an itch-reduced difference on 0.42 (SEM = .20) relative to the vehicle (t = 2.07 df = 30 p .05). STUDY II Intrasubject reliability was determined by correlating the pretreatment test sites and additionally by computing a Cronbach's alpha. One subject was eliminated from the analysis because her values represented a significant multidimensional outlier. The results of these analyses indicated that there was a high level of reliability, with the tO • SITE 2 to Figure 3. Intrasubject reliability. Pretreatment itch ratings at two test sites (r = .92).

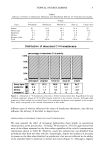
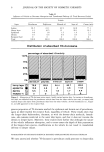
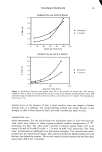
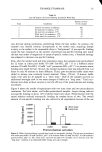
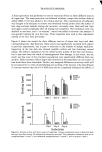
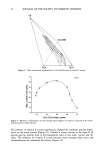
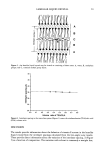
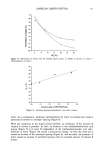
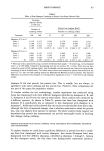
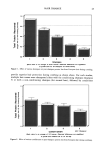
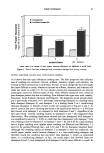
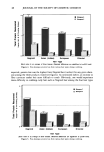
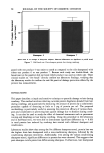
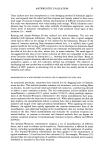
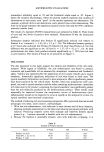
ANTIPRURITIC EVALUATION 63 intrasubject reliability equal to .92 and the Cronbach's alpha equal to .95. Figure 3 shows the intrasite relationships, where the plotted markers represent that number of observations at each point each "petal" on the marker represents one observation. For example, a plotted circle is one observation, and a plotted cross is four observations. The lines on the graph represent the regression equation (center line) and the 95 % confidence intervals (outside lines). The results of a repeated ANOVA measurements are presented in Table II. Three levels of time and two levels of product were analyzed. Formulation B was the benzocaine product. Subsequent analysis indicated that Product B significantly reduced itch relative to Product A at 1 minute (t = 2.41 df = 41 p .02). The difference between products at 0.5 hours also indicated that Product B reduced itch more than Product A, but this difference was not significant at the .05 level (t = 1.57 df = 41 p . 12). At both posttreatment test times, both products showed significantly (p .001) less itch than at pretreatment. The results of Study II are presented in Figure 4. DISCUSSION The data presented in this paper support the validity and reliability of the itch esthe- siometer. With regard to reliability, the itch esthesiometer was found to produce consistent and quantifiable itch as measured by intrasubject correlation and Cronbach's alpha. Validity was examined after the application of oil-in-water vehicles and a topical anesthetic. Statistically significant reductions of itch were found in both cases. The topical anesthetic formulation was found to have antipruritic effects significantly greater than those produced by the vehicle alone. Further, when two antipruritics were com- pared, one with a topical anesthetic and the other containing hydrocortisone, immediate itch reduction by the product containing the topical anesthetic was significantly greater than the itch reduction produced by the hydrocortisone product. These results could reasonably be expected because the antipruritic action of hydrocortisone (anti- inflammatory) would not be expected to occur as rapidly as the antipruritic action of a topical anesthetic (anti-neuronal conduction). The method of inducing itch and measuring antipruritic effect presented here has several advantages over other, more invasive, methodologies: 1. With the itch esthesiometer, itch induction is more discrete and of short duration, allowing multiple measurements to be taken and reducing perceptual problems with subjects. Producing response curves with multiple and relatively densely spaced points (e.g., 1-minute intervals) is feasible with the itch esthesiometer. 2. Because the method is minimally invasive, even with mild skin stripping, it is Table II Analysis of Variance Results Factor F-Value DF P Level Product (A or B) 4.82 41,1 .034 Time (Pre, 1 m, 0.5 h) 10.59 41,1 .002 Product x time .87 41,1 .357
Purchased for the exclusive use of nofirst nolast (unknown)
From: SCC Media Library & Resource Center (library.scconline.org)