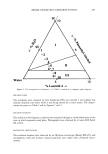
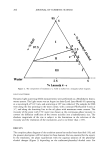
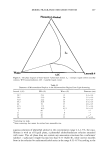
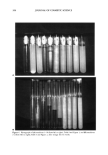
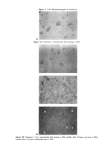
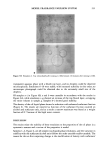
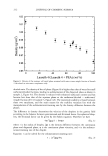
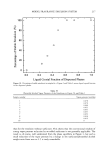
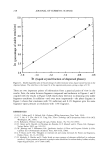
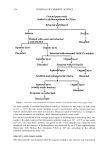
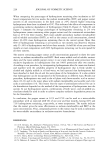
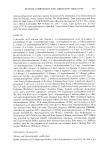
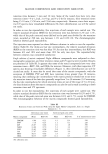
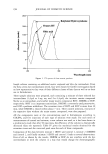
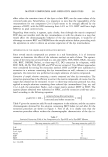
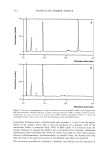
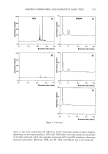
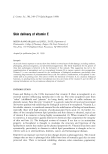
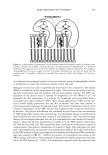
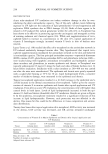
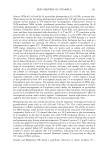
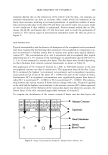
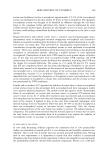
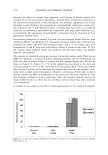
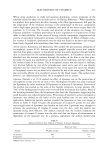
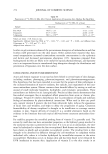
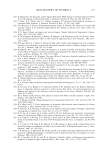
216 JOURNAL OF COSMETIC SCIENCE Figure 9. Photograph of emulsions 1-10 between crossed polarizers viewed against a light source. This approach implies an assumption that the liquid crystal forms a fractal structure with a constant area perpendicular to its direction of extension, a reasonable assumption. Hence the characteristic length of the dispersion system becomes proportional to the liquid crystal fraction of the dispersed phases. Using equation 5 a linear curve is obtained from the double-logarithm plot of the percentage of stable emulsion versus the liquid crystal fraction of the dispersed phases (Figure 11). The slope of the line (Figure 11) gives an estimation of the order of dimension of the system, approximately 2.5, which is not unreasonable considering the structure of the lameliar liquid crystal. Final explanation of this result must await exact structural determinations of these emulsions, but it is obvious that "emulsions" 8-10 and "emulsions" i and j in Figure 4 are in fact vesicle dispersions (24). Laureth 4 has been shown readily to form stable vesicles (29), and the stability of the vesicular dispersion is expected. The fact that the tie-lines (Figure 3) emanate from aqueous solutions of low concentra- tions of the alcohol and the fact that the evaporation of alcohol is negligible compared to that of water means that the vapor pressure of the alcohol remains approximately constant one half hour after application. It has been found that most of the water in skin-care formulations is evaporated within 30 minutes after application (30) and that the values of vapor pressure in the used system (19) allow an estimation of the vapor pressure of the present emulsions. The vapor pressures are given in Table IV. It is highly noteworthy that the vapor pressures of emulsions 4-7 in Figure 4A remain at such a high level, only 32% lower

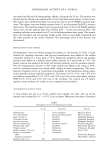
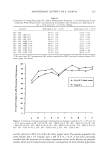
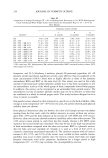
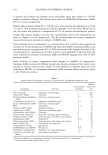
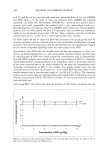
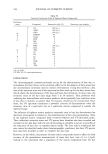
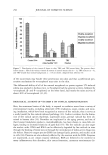
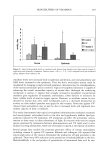
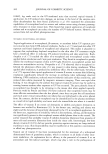
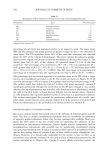
MODEL FRAGRANCE EMULSION SYSTEM 217 lOO 8o 8o 40 20 0 [] I 0.0 I ' I ' I ' I ' I ' I [] [] [] - I , I I • I , I • I 0.2 0.4 0.6 0.8 1.0 Liquid Crystal Fraction of Dispersed Phases Figure 10. Percentage of stable emulsion in samples b-i, Figure 2 and Table I, versus liquid crystal fraction in the dispersed phases. Table IV Phenethyl Alcohol Vapor Pressures of the Emulsions in Figure 5A and Table I Sample number Vapor pressure (mmHg) 1 0.078 2 0.070 3 0.060 4 0.053 5 0.053 6 0.053 7 0.052 8 0.036 9 0.012 0 0 than for the emulsion without surfactant. This shows that the conventional wisdom of strong vapor pressure reduction by an added surfactant is not generally applicable. The result is, of course, well understood from the phase equilibria in Figure 3, but such a small reduction of the vapor pressure by a change in the surfactant/phenethyl alcohol weight ratio from zero to 2.5 is truly remarkable.
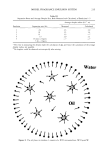
Purchased for the exclusive use of nofirst nolast (unknown)
From: SCC Media Library & Resource Center (library.scconline.org)