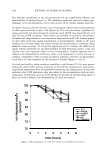
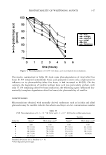
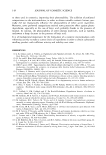
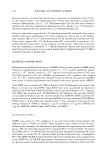
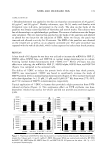
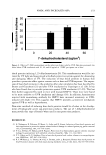
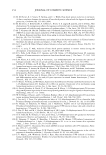
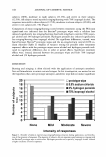
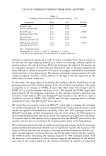
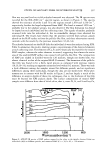
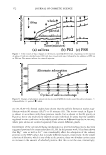
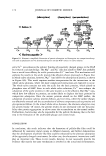
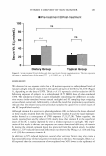
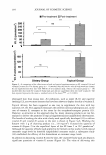
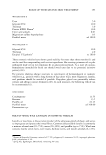
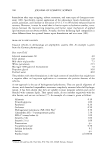
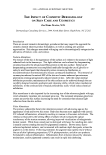
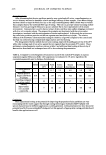
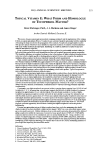
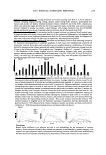
2003 ANNUAL SCIENTIFIC MEETING 229 Subiective i"itation (figure 2). Average maximum score levels (scoring scale from 0 to 4) of subjective irritation, including stinging, burning, itching, dryness, and/or foreign body sensation, demonstrated that mascara and powder eye shadow exhibited moderate irritation (2.8±0.102 and 2.45± 0.182, respectively), which were statistically higher (p0.05) than the remaining product types, except baby wash and eye makeup remover compared to powder eye shadow. Liquid makeup, with average maximum score level 0.5±0.088, elicited significantly lower levels of reported subjective irritation than all other products (p0.05). Obiective irritation (figure 3). No lacrimation, eyelid or corneal irritation was observed for all product types. Average maximum score levels (scoring scale from Oto 4) for conjunctiva} inflammation, with palpebral and bulbar conjunctiva! scores combined (combined scale from Oto 8), were significantly higher for shampoo and baby wash, with scores 4.075±0.126 and 4.1±0.16, respectively, than other products (p0.05). Distribution offluorescein staining (figure 4). Maximum area and density scores at each examining time point for fluorescein staining patterns of component quadrants of each tissue were multiplied and totaled for all examination intervals. Scores from each evaluated tissue were weighted based on a modification of the Draize method for assessing ocular irritancy potential and totaled to determine an overall fluorescein staining score for all eyes by the following equation: Total weighted score = (palpebral + bulbar) x 2 + cornea x 5 = canruncle x I, The distribution of the average weighted score for liquid makeup, shampoo, baby wash, eye makeup remover, mascara, powder eye shadow and facial cleanser were 11.4±1.34, 31.03±152, 39.19±._2.70, 9.6±0.91, 39.92± 3.45 and 9.55±1.98, respectively. The scores of shampoo, baby wash and powder eye shadow were significantly higher than those of other products (p0.05). , Figure 2 Figure 3 Figure 4 111 1{ ·i 1,:: Jj,. J ., H �j r I .: .i I I I I I I '.:J f w �i I I I I I I i a.r.- £:= .... � F.--- .... fpt ....... ':: , ____ .,._ - ..._..,., ____ Time Course of Ocular Irritation (figure 5). Subjective reports and objective irritation, as well as fluorescein staining were observed during the post-instillation time course. Average subjective irritation scores for all types of products peaked at 30 seconds post-instillation and decreased markedly at 5 minutes, except powder eye shadow, which maintained a high score level until 15 minutes (A). Objective ophthalmic irritation varied among the product types in severity at each interval (B). Objective ophthalmic scores decreased after 30 seconds for liquid makeup, mascara, eye makeup remover and powder eye shadow, and after 15 minutes for shampoo and baby wash. However, objective irritation for facial cleanser maintained the same level for 120 minutes following ocular instillation. Average weighted scores (C) of fluorescein ophthalmic staining on ocular surfaces revealed that superficial punctate staining was increased to peak levels at 15 minutes for shampoo, baby wash, eye makeup remover, mascara, and powder eye shadow and at 60 minutes following ocular instillation for liquid makeup and facial cleanser. Most ocular irritation resolved after 24 hours. The statistical analysis of weighted scores for fluorescein staining at examination intervals demonstrated very good correlation (r 0.95) between facial cleanser, shampoo or powder eye shadow and baby wash and fair correlation (r 0.80) between liquid makeup remover and mascara (data not shown). Figure 5 Conclusions · II ,5 .... � C Human ocular instillation is an effective and safe in vivo methodology for the assessment of cosmetic irritancy. Ocular irritation elicited by the evaluated test materials varied markedly by product category, with respect to the type (subjective reports, inflammation and staining), duration, and ocular tissue, demonstrating that these factors are important considerations for the prediction of the ocular initancy of a test material.

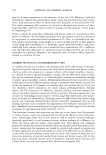
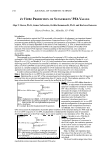
230 JOURNAL OF COSMETIC SCIENCE IN VITRO PREDICTION OF SUNSCREENS' PFA VALUES Olga V. Dueva, Ph.D., James SaNoueira, Ovidiu Romanoschi, Ph.D. and Barbara Donovan Playtex Products, Inc., Allendale, NJ 07401 Introduction Effective protection against the UV A associated with cumulative skin damage is an important element of sunscreen and anti-aging cosmetic formulations. Protection Factor A (PF A) - JCIA method based on persistent pigment darkening (PPD) [I], can measure UVA protection of sunscreens. PPD is a stable skin response, which is linearly dependent on the dose of UVA irradiation [2,3]. PFA is determined from the ratio of the sunscreen-protected minimal PPD to the unprotected PPD, evaluated 2-4 hrs after UVA exposure. The time of UV A exposure is based, according to the test protocol [1], on a sunscreen 's estimated PF A value. Thus, correct in vitro prediction of a sunscreen's PFA is essential for the accuracy of in vivo tests. Method Description. The proposed in vitro method for the prediction of a sunscreen's PF A values was developed and �valuated in 2001-2003 by integrating and optimizing methodologies described by Chardon A. et al., Moya! D. et al. [2,3], and Wendel V. et al. [4]. In this method we have considered and addressed the following issues: PF A potential of a sunscreen is defined by its' attenuation in the UV A region biological effects ofUVAI (340-400 nm) and UVA2 (320-340 nm) on skin are very different [5,6] PPD action spectrum is a reliable endogenous dosimeter for UV A irradiation that enters the skin [2,3] substrate, application dose and statistical approach are important for the accuracy of in vitro measurements. In order to obtain a prediction of a sunscreen 's PF A the following steps are recommended. � Determine the in vivo SPF for the sunscreen on at least five panelists. Step 2. Determine the in vitro SPF of the sunscreen based on its absorbance spectrum in the UV region [7] utilizing Vitro skin as substrate and application dose of 2 mg/sq. cm [8]. The irradiance spectrum of the lamp source should reflect the one that is used by the testing lab for PF A tests. Equation 1: SPF in vivo= SPF in vitro= -40-0-nm�� 2 90 ="= m ____ _ JE(1.)· S(1.)/10[A(,-}c] 290nm Where: E(,i) = irradianceat wavelergth ,l of the light spectrum used S(,1) = effectiveress of a biological endpoint at wavelergth A Note: for the SPF it is erythemaaction spectrum A(,1) = absorbance C = constant factor for theadjustmentof the spectrum Step 3. If in vitro SPF differs from the in vivo SPF, an adjustment of the absorbance spectrum is needed "to nonnalize" it to the SPF value obtained in vivo (Eq. 1 ). This eliminates the impact of the thickness of the applied layer on the absorbance spectrum of a sunscreen. During this adjustment only the height of the sunscreens' absorbance spectrum is corrected to correspond to its' in vivo SPF and the configuration of the spectrum that depends on the composition of actives is not affected. This "normalization" also takes into account the implications of possible photo-instability of the sunscreen during its' PF A study [9]. If in vitro SPF is equal to in vivo SPF, no adjustment is needed and the integration area of sunscreens' absorbance spectrum in the UV A 1 region "as is" can be used for in vitro estimation of its' PF A (Eq. 2). Equation 2: Step 4. Calculate in vitro PF A (Eq.2) 400 nm using: the integration area of the f E(A)·S(A) "normalized" spectrum of a sunscreen in PFA - PPD in vitro= 400 n m 34 o n m the UV A 1 region, the irradiation spectrum J E(A)·S(A)VIO[A(1.}c] of the 150 wt xenon arc lamp with 2 mm 340nm Where: E(),} = irradiance at wavelength A of the light spectrum used S{),. J = effectiveness of a biological endpoint at wavelength A Note : for the PPD prediction it is PPD action spectrum A{A)= absorbance C = constant factor for the adjustment of the spectrum as in Eq. I. standard deviations) represents the predicted PFA value. WG355 and I mm UG 11 filters, and the PPD action spectrum. Step 2 to Step 4 are repeated at least five times. From the set of in vitro PF As, the average and the standard deviation are calculated. The lower bound (average minus three
Purchased for the exclusive use of nofirst nolast (unknown)
From: SCC Media Library & Resource Center (library.scconline.org)