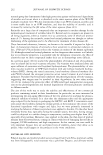
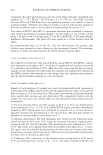
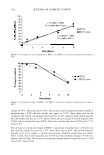
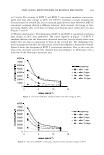
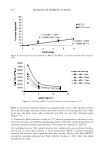
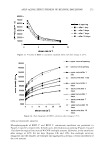
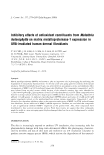
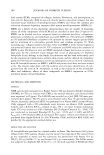
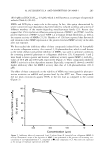
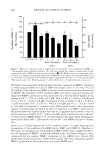
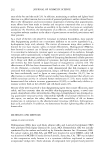
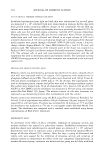
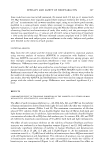
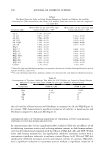
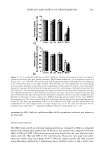
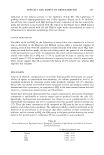
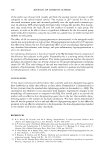
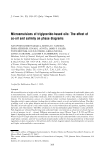
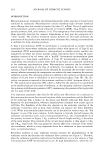
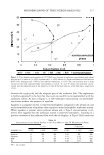
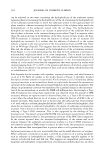
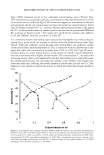
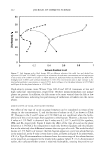
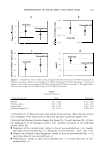
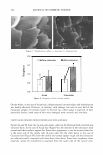
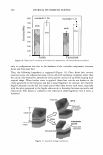
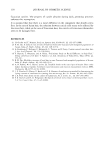
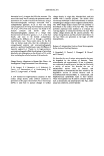
272 100 90 "O 80 "O 70 cu 60 "O 50 40 cu 30 ... � 0 20 10 0 JOURNAL OF COSMETIC SCIENCE y = 2,4 706x + 1,4034 R2 = 0,8665 RETI C cone 0 2 4 6 8 time (days) ♦RETI C ■RETI C cone y = 2,4477x - 0,0805 R2 = 0,9655 RETI C 10 Figure 9. Percentage of retinal degradation in RETI C and RETI C concentrate emulsions after storage at 25 ° C. 80000 70000 en 60000 50000 .§. • at opening - • - after 1 day � 40000 - - • - ·after 3 days 30000 - -E- • after 7 days 20000 ·s;: - -Jf - after 10 days 10000 0 a 5 10 15 Figure 10. Viscosity of RETI C emulsion before and after storage at 25 ° C. RETI C concentrate emulsion showed an irregular trend. In fact, after the first and the third day of storage a decrease in shear stress was observed at increasing shear rates. After seven days the shear stress values increased, and after ten days they decreased again (Figure 13). (c) Conductivity. Both emulsions stored at 25 ° C showed progressively a decrease in con ductivity over time, nevertheless maintaining values in the order of mS, characteristic of emulsions having external acqueous phase. The results are reported in Table II. (d) Centrifugation assay. The studied systems were submitted to an accelerated techno logical test to assess their stability at room temperature. RETI C emulsion remained unvaried and showed a little separation after only ten days. On the other hand, RETI C concentrate emulsion demonstrated high stability because it didn't show any phase separation over time.

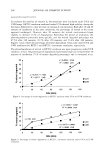
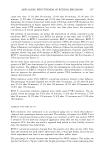
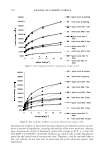
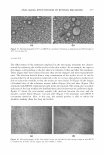
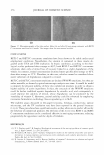
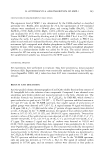
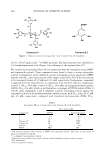
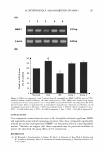
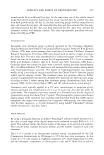
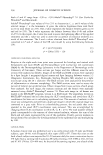
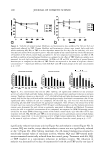
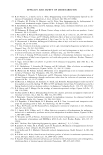
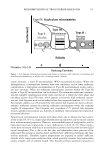
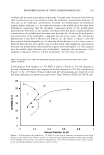
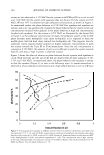
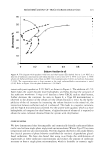
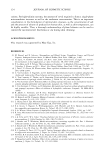
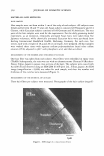
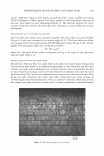
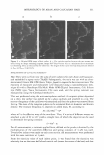
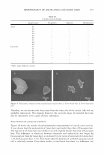
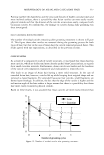
in .s , · ·s: .s en en U) ANTI-AGING EFFECTIVENESS OF RETINOL EMULSIONS 273 80000 70000 60000 • at opening 50000 - • - after 1 day 40000 - - • - ·after 3 days 30000 - ..f- - after 7 days 20000 - -:a - after 10 days 10000 0 a 5 10 15 Fi gu re 11. Viscosity of RETI C concentrate emulsion before and after storage at 25 ° C. 185000 165000 145000 125000 105000 85000 65000 45000 25000 5000 D 5 10 15 20 25 shear rate (s- 1 ) -◄•-- upper curve at opening - - - • - - back curve at opening .a. upper curve after 1 day - - - A- - - back curve after 1 day )I( upper curve after 3 days - - - x- - - back curve after 3 days --i---upper curve after 7 days - - - +- - - back curve after 7 days o upper curve after 10 days - - - o- - - back curve after 10 days Figure 12. Flux rheograms of RETI C emulsion after storage at 25 ° C. OPTICAL MICROSCOPE ANALYSIS Microphotographs of RETI C and RETI C concentrate emulsions are presented in Figures 14 and 15, respectively. In both cases, the emulsions at opening (Figures 14a and 15a) show the typical structure ofW/O/W multiple systems. However, in the emulsions after storage at 40 ° C for ten days (Figures 146 and 156), this multiple structure disappears and the droplets are enlarged and aggregated, proving a certain instability of the two systems.
Purchased for the exclusive use of nofirst nolast (unknown)
From: SCC Media Library & Resource Center (library.scconline.org)