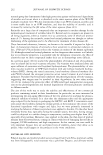
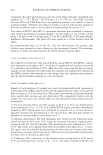
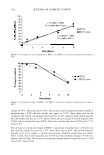
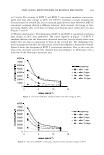
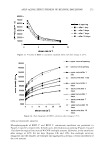
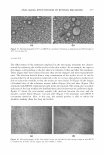
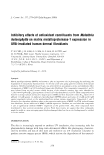
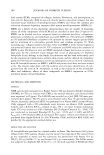
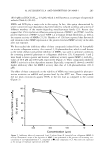
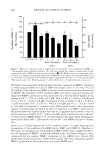
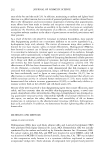
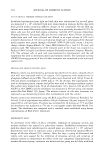
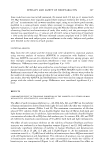
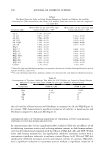
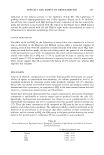
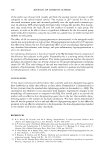
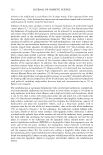
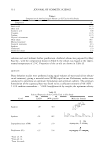
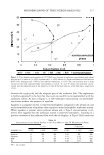
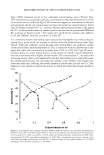
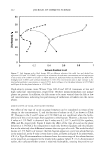
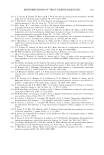
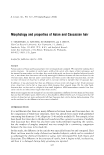
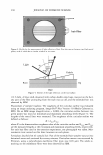
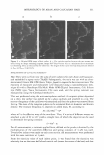
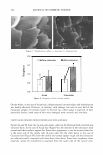
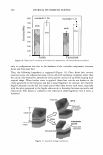
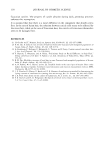
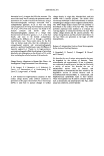
270 cu en en en .§. II) 185000 165000 145000 125000 105000 85000 65000 45000 25000 5000 185000 165000 145000 125000 105000 85000 65000 45000 25000 5000 0 0 5 JOURNAL OF COSMETIC SCIENCE 10 15 20 25 shear rate (s· 1 ) --.•--upper curve at opening - - ♦ - · back curve at opening al. upper curve after 1 day - - 11.- - · back curve after 1 day • upper curve after 3 days - - IC- - · back curve after 3 days ----upper curve after 7 days - - + - · back curve after 7 days -�e..---upper curve after 1 O days - - 0- - · back curve after 10 days Figure 7. Flux rheograms of RETI C emulsion after storage at 40 ° C. 5 10 15 shear rate (s. 1 ) 20 25 • upper curve at opening - - ♦ - · back curve at opening al. upper curve after 1 day - - * - · back curve after 1 day • upper curve after 3 days - - IC- - · back curve after 3 days ---upper curve after 7 days · - + · · back curve after 7 days -""'e--upper curve after 10 days - - 0- · · back curve after 10 days Figure 8. Flux rheograms of RETI C concentrate emulsion after storage at 40°C. Sometimes the medium in which the functional substances are dispersed could be an alter native substrate of degradation, increasing the stability of the active molecules. Anyway, upon observing the results of rheological studies after storage at 40 ° C, it is clear that both RETI C and RETI C concentrate emulsions go towards only a slight degradation, proved by the limited loss of viscosity over time. Therefore, it can be concluded that in this case vehicles do not take part in protecting the active substances against their degradation.

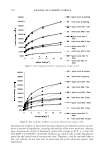
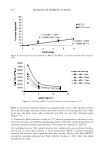
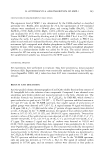
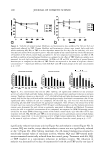
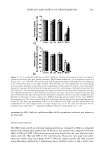
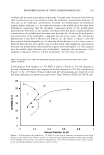
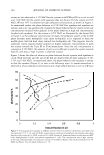
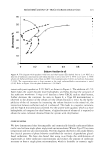
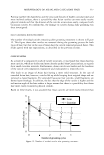
ANTI-AGING EFFECTIVENESS OF RETINOL EMULSIONS 271 (c) Conductivity. Conductivity significantly changed after storage at 40°C. The relatively high values indicated the presence of a continuous aqueous phase. The data are reported in Table I. (d) Centrifugation assay. The phase separation of RETI C and RETI C concentrate emul sions stored at 40°C was evaluated. RETI C emulsion showed a partial separation after three days of storage, but the separation progressively increased over time, being evident after ten days. RETI C concentrate emulsion appeared less stable at high temperature, compared to RETI C emulsion. In fact, RETI C concentrate emulsion showed a little phase separation after only a week. After ten days it appeared considerably separated. STABILITY OVER TIME AT 25 ° C The organoleptic features of RETI C emulsion stored at room temperature changed over time. Particularly, their color changed after seven and ten days, becoming dark yellow. RETI C concentrate emulsion appeared pale yellow after one day, but the color inten sified over time. After ten days of storage the emulsion was dark yellow in color. As regards concentration stability, RETI C emulsion did not show any retinal degra dation after one day at room temperature, but after three days the retinal concentration decreased by 10.3% in comparison to its initial concentration. After a week at 25°C, the percentage of degradation was 16.8%, and after ten days 23.9%. RETI C concentrate emulsion followed a similar trend. The concentration of retinol began to decrease after three days of storage and showed a decrease of retinal equal to 15. 5 % , while after seven and ten days the percentage of retinol degraded was 19.4% and 24.0%, respectively. In Figure 9 the percentage of retinol degraded after storage at 25°C is reported. (a) Viscosity. In Figure 10 the viscosity values of RETI C emulsion before and after storage at 25°C are plotted. They decreased over time, indicating a low instability in the system. RETI C concentrate emulsion showed an anomalous behavior. In fact, the viscosity decreased after one and three days at room temperature, increased after a week, and decreased again after ten days. The curves recorded at different shear rates are reported in Figure 11. ( b) Rheologic determinations. The evolution of rheological properties of emulsions stored at room temperature were investigated by plotting shear stress versus shear rate values. The shear stress values of RETI C emulsion showed a clear decrease over time. At the beginning of the test, the preparation had a pseudoplastic rheological behavior with very small thixotropic hysteresis areas. After seventh day, the system showed a flux inclining to Newtonian. The flux rheograms of RETI C emulsion after storage at 25°C are reported in Figure 12. Table I Conductivity of RETI C and RETI C Concentrate Emulsions After Storage at 40°C Days of storage RETI C RETI C concentrate 1 2.89 mS 1.42 mS 3 1.53 mS 1.30 mS 7 1.55 mS 0.64 mS 10 1.16 mS 1.23 mS
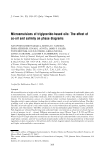
Purchased for the exclusive use of nofirst nolast (unknown)
From: SCC Media Library & Resource Center (library.scconline.org)