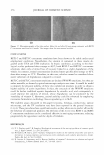
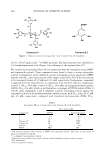
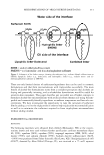
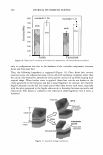
296 JOURNAL OF COSMETIC SCIENCE Both a* and b* range from -120 to + 120 (Adobe® Photoshop® 7.0 User Guide for Windows® and Macintosh). Adobe® Photoshop® uses values of 0 to 255 to characterize L, a, and b values of the selected image. L is the luminance. It gives the relative brightness from total black (L=0) to total white (L=255). The a value represents the balance between green (a=0) and red (a=255). The b value represents the balance between blue (b=0) and yellow (b=255). In this report, the L value was used to assess the lightening effect of the applied treatment and the a value was used to assess the occurrence of irritation (redness) as a result of the treatment. The L and a values obtained from Adobe® Photoshop® were converted to L * and a* values of the CIE color model by using the following formulas (24): HISTOLOGY AND IMAGE ANALYSIS L* = (L/255) (100) a*= (240a/255) - 120 (1) (2) Biopsies at the eight-week time point were processed for histology and stained with hematoxylin and eosin (H&E) and Fontana-Mason with nuclear fast red counterstain (F&M) by the Dermatopathology Laboratory in the Department of Dermatology at the University of Cincinnati. Three sections per biopsy and five different areas for each section were analyzed as follows: Images of the H&E and F&M sections were captured by a Spot Insight 4 megapixel-digital camera and Spot Imaging Software version 3.2 (Diagnostic Instruments, Inc., Burroughs, Sterling Heights, MI) attached to a light microscope using the 20 x objective. The H&E sections were analyzed for the presence of inflammation or aberrant morphology. The F&M sections were used to assess the percent of melanin per epidermal area. Fifteen images from tissues sections of each group were analyzed. For each image, the stratum corneum and the dermis were manually extracted using Adobe® Photoshop® version 7.0. Then each image in .tif format was loaded in the MATLAB® program, version 6, in RGB mode. The algorithms written in MATLAB® evaluated the red color along the (X,Y) coordinators, and saved these (X,Y) coordinators for later use in calculating epidermal size. The amount of melanin in the tissue was subsequently assessed from a duplicate image in which the original image was converted to a gray scale. Prior to a thresholding process, the red pixels that corre sponded to the saved (X,Y) coordinators were removed. This was accomplished by changing these (X,Y) coordinators to white (R, G, B = 255). The total number of black pixels corresponded to the amount of silver-stained melanin, whereas the sum of the black and red pixels represented the size of the epidermis. Finally, percent melanin in the epidermis was calculated by dividing melanin by the epidermal size and multiplying by 100. CLINICAL TRIAL A human clinical trial was performed over a six-week period with 25 male and female subjects, ages 18-60, with Fitzpatrick skin types of III or IV. Three skin sites on the back of each subject were exposed for 10-20 minutes daily for seven consecutive days to UV light from a tanning bed (Cosmolux AS bulbs emitting 2.6% UVB at 260-320 nm and 97.4% UV A at 320-400 nm). At the end of the tanning regimen, one of each of the

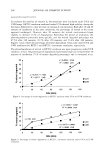
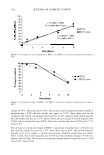
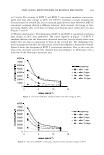
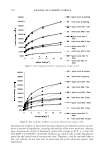
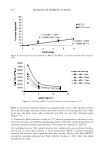
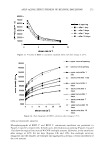
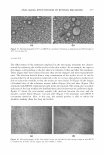
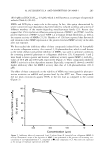
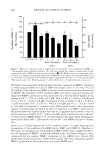
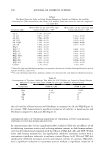
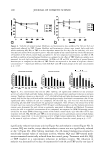
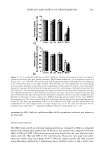
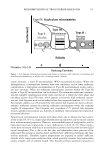
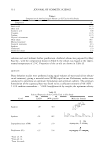
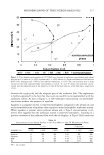
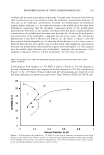
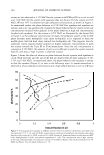
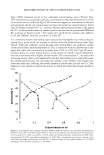
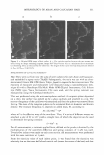
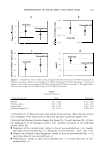
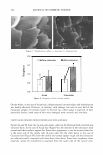
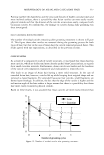
EFFICACY AND SAFETY OF DEOXYARBUTIN 297 three coded test sites was (a) left untreated, (b) treated with 3% dA, or (c) treated with 4% HQ. Treatments were topically applied three times per week for five weeks, at 12.5 µ1/2 cm2 in moisturizer (oil-in-water emulsion type), using an occlusive patch system, modified to a semi-occlusive system when necessary to manage irritation. For skin lightness evaluation, L values were obtained using the Minolta Chroma Meter at the end of tanning (baseline) and termination of study (five weeks), and the percentage of tan retained was quantitated (i.e., L value at end of trial/L value at beginning of treatment x 100) at the end of the trial. Written informed consent compliant with 21 CFR 50.25 was obtained from each subject prior to enrollment in the study. Subjects and graders were blinded to the identity of each product. STATISTICAL ANALYSIS Data from the cell culture and the clinical trial were subjected to statistical analysis using one-way analysis of variance (ANOV A) in conjunction with Student's t-test. One-way ANOV A was used to determine if there were differences among groups, and then multiple comparison procedures (Bonferroni t-test) were used to isolate these differences. Differences were considered significant if P 0.05. Animal results (11.L and da) were analyzed as a one-between (subject) one-within (time) repeated-measurement analysis of variance using the PROC MIXED model in SAS. The Bonferroni correction of the p-value was calculated by dividing the test-wise p-value by the number of comparison groups (p-value for our animal study = 0.004). For epidermis size results, One-way ANOVA and the Bonferroni t-test were used to compare treatment groups with the vehicle control group. Differences were considered significant if p 0.05. RESULTS COMPARATIVE EFFECT OF TYROSINASE INHIBITORS ON THE VIABILITY OF CULTURED HUMAN MELANOCYTES, KERATINOCYTES, AND FIBROBLASTS The effect of each tyrosinase inhibitor (i.e., dA, HQ, KA, AR, and TBP) on the viability of human melanocytes derived from both light (lt) and dark (dk) skin was evaluated in a dose-dependent manner (Tables I and II). The maximum concentration of dA that allowed 95 % viability (Table II) was fourfold higher than that of HQ on both dark and light human melanocytes. In addition, light melanocytes could tolerate a fourfold higher concentration of either dA or HQ than dark melanocytes. In contrast, KA, AR, and TBP all exhibited a maximum concentration of 50 µM for both dark and light melanocytes. The effect of each tyrosinase inhibitor on the viability of human fibroblasts and kera tinocytes was evaluated in a dose-dependent manner (Figures 1 and 2). HQ exhibited a statistically significant inhibition of viability in human fibroblasts and keratinocytes compared to dA at 25 µM, 12.5 µM, and 6.25µM (Figure 1). At the maximum con centration tested (i.e., 25 µM), loss of viability in keratinocytes due to HQ was associated with cell fragmentation and detachment. This indication of apoptosis was not apparent in keratinocytes treated with dA at the same concentration at which the viability of keratinocytes was compromised (Figure lc-e). AR and KA demonstrated less effect on
Purchased for the exclusive use of nofirst nolast (unknown)
From: SCC Media Library & Resource Center (library.scconline.org)