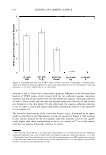
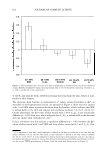
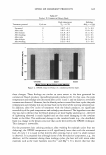
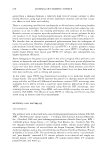
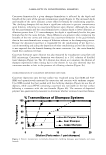
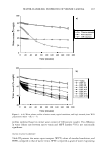
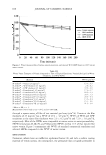
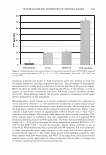
RANKING OF SURFACTANT-HUMECTANT SYSTEMS 615 should stress that the TEWL measurements and the visual skin dryness scores determine the extent of intercellular lipid bilayer perturbation in the SC, while the chromameter measurements of erythema (skin redness) determine the extent of denaturing of the keratins in the corneocyte/keratinocyte domains of the SC and the VE (viable epidermis), which leads to an increase in the cutaneous blood flow and associated skin redness (13-16,19-22,24-29,37). Therefore, the results in Figure 5 indicate that SDS induces a larger extent of erythema relative to C 12 E6, because SDS can interact strongly with the keratins of the corneocytes and the keratinocytes relative to C 12 E 6 . As a result, because SDS can interact with both the keratins and the intercellular lipid bilayers in the SC, while C 12 E6 can interact only with the intercellular lipid bilayers in the SC, SDS can induce a larger extent of skin barrier perturbation relative to C 12 E 6 ( 13-16,21-2 5 ,29). The in vitro skin barrier measurements discussed in the Experimental section corroborate this finding. In Figure 5, the bars corresponding to the Aa* values of the in vivo control (iii) and of the two aqueous humectant solutions (iv and v) are below the zero level, which indicates that no skin erythema was observed in these three cases. In addition, no statistical difference (p 0.05) was observed between the Aa* values of the in vivo control (iii), which is an untreated skin test site, and 10 wt% PG. However, a statistically significant difference (p 0.05) was observed between untreated skin and skin exposed to 10 wt% G. These results indicate that glycerol has a stronger beneficial impact on the skin barrier relative to propylene glycol, which is consistent with the in vitro ranking metric results discussed above (30-34,36). RELATIONSHIP BETWEEN THE IN VITRO AND IN VIVO SKIN BARRIER PERTURBATIONS INDUCED BY AQUEOUS SURFACTANT-HUMECTANT SYSTEMS The in vitro ranking metric (RM) analysis and the mannitol skin permeability measure ments indicate that the two surfactant, aqueous contacting solutions (i and ii) induce a significantly larger extent of skin barrier perturbation relative to the in vitro PBS control (iii) and relative to the two humectant aqueous contacting solutions (iv and v). The in vivo TEWL measurements, the visual skin dryness scores, and the chromameter mea surements of in vivo skin erythema (redness) are consistent with the in vitro results (see Figures 3-5). The in vitro ranking metric analysis also predicts that aqueous contacting solution i, containing 1 wt% SDS, induces the largest extent of skin barrier perturbation in vitro. Conversely, aqueous contacting solution v, containing 10 wt% G, was predicted to induce the smallest extent of skin barrier perturbation in vitro. A similar result was obtained from the chromameter measurements of in vivo skin erythema (see Figure 5). Note that the TEWL values (see Figure 3) and the visual skin dryness scores (see Figure 4) corresponding to 1 wt% C12E6 were found not to be statistically different (p 0.05) from those corresponding to 1 wt% SDS. In addition, the in vitro RM analysis and the mannitol skin permeability measurements indicate that aqueous contacting solution v, containing 10 wt% G, induces a smaller extent of skin barrier perturbation, and there fore better preserves the skin barrier relative to aqueous contacting solution iv, contain ing 10 wt% PG (see Table II). This result is consistent with the chromameter mea surements of in vivo skin erythema (see Figure 5). In view of the agreement between the in vitro ranking metric analysis and the in vivo skin barrier measurements summarized above, the methodology presented here to rank ague-

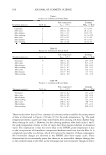
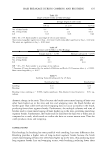
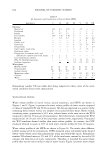
616 JOURNAL OF COSMETIC SCIENCE ous surfactant-humectant systems based on their ability to perturb the skin aqueous pores in vitro should be useful to a formulator of skin care products who is interested in understanding skin barrier perturbation induced by aqueous surfactant-humectant sys tems in vivo. The in vitro ranking methodology presented here represents a novel ap proach to rank surfactants and humectants used in skin care formulations, and may potentially reduce, or eliminate altogether, the need to conduct costly and time consuming in vivo skin barrier measurements. COMPARISON OF THE IN VITRO AND IN VIVO EFFECTS OF ADDING 10 WT% GLYCEROL TO AN AQUEOUS SDS CONTACTING SOLUTION We have recently presented an in vitro analysis that makes use of skin electrical current and mannitol skin permeability measurements to determine the effect of adding 10 wt% glycerol to an aqueous SDS contacting solution (6). Specifically, skin electrical current and mannitol skin permeability values were measured following exposure of p-FTS to an aqueous contacting solution containing SDS (1 wt%) + G (10 wt%). These values are reported again in Table III for completeness (see the in vitro results). In terms of the ranking metric (RM) analysis presented here (see the Theoretical section), a RM value of 4.1 ± 1.0 corresponds to an aqueous contacting solution containing SDS (1 wt%) + G (10 wt%), a value that is obtained by taking the ratio of the skin electrical current values in Table III corresponding to the aqueous contacting solution containing SDS (1 wt%) + G (10 wt%) (49 ± 10 µA) relative to the in vitro PBS control (12 ± 3 µA). On the other hand, Table III also shows that the RM value corresponding to an aqueous contacting Table III In Vitro and In Vivo Skin Barrier Measurements for Aqueous Contacting Solutions Containing SDS (1 wt%) and SDS (1 wt%) +- glycerol (10 wt%), Including a Comparison with the Appropriate In Vitro/In Vivo Controls Aqueous contacting solutions SDS SDS (1 wt%) + Control Skin barrier measurements (1 wt%) glycerol (10 wt%) (in vitro/in vivo)* In vitro Skin electrical current (�1A) 91 ± 10 49 ± 10 12 ± 3 Mannitol skin permeability (cm/hr) X 10 5 66 ± 10 30 ± 10 7 ± 3 Average pore radius, r 1JOI , (A) 33 ± 5 20 ± 5 20 ± 3 Enhancement in p = pjfc,** 2.6 ± 1 2.9 ± 1 1 In vivo TEWL (barrier damage) 5.30 ± 0.20 4.00 ± 0.40 3.40 ± 0.30 Visual skin dryness 0.89±0.11 0.60 ± 0.13 0.15 ± 0.02 Chromameter (erythema) 0.57 ± 0.11 0.58 ± 0.14 -0.08 ± 0.05*** *Thein vitro control corresponds to PBS in water (aqueous contacting solution iii), and the in vivo control corresponds to a no-reaction, non-occluded control (see the Experimental section). ** The enhancement in the aqueous pore number density, p, is reported relative to the in vitro control. In addition, recall that E denotes enhancer (that is, aqueous contacting solutions i, ii, iv, and v) and C denotes the in vitro control (that is, aqueous contacting solution iii). *** Note that the in vivo control shows erythema values close to zero, which is not unexpected (the small negative mean value of -0.08 results from the fact that some of the volunteers in the control group exhibited lower skin redness on Day 2, when compared to Day 1). The table reports average values and standard errors.
Purchased for the exclusive use of nofirst nolast (unknown)
From: SCC Media Library & Resource Center (library.scconline.org)