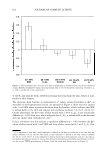
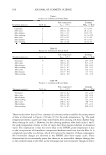
RANKING OF SURFACTANT-HUMECTANT SYSTEMS 617 solution containing SOS (1 wt%) is (91 ± 10)/(12 ± 3) = 7.6 ± 1.0, which is signifi cantly higher than the RM value of 4.1 ± 1.0 corresponding to an aqueous contacting solution containing SOS (1 wt%) + G (10 wt%). Therefore, as we have shown recently (6), adding 10 wt% G to an aqueous contacting solution containing 1 wt% SOS significantly reduces in vitro skin barrier perturbation. The mannitol skin permeability values reported in Table III also indicate a decrease in skin barrier perturbation induced by an aqueous contacting solution containing 1 wt% SOS + 10 wt% G (P = 30 ± 10 x 10- 5 cm/hr), relative to an aqueous contacting solution containing 1 wt% SOS (P = 66 ± 10 x 10- 5 cm/hr). A separate study was conducted as described earlier, comparing the effects of SOS (1 wt%) to SOS (1 wt%) + G ( 10 wt%) on the skin of healthy human volunteers to validate the in vitro model. The in vivo TEWL results in Table III indicate that the deviation from baseline in the TEWL value of skin treated with SOS (1 wt%) + G (10 wt%) is statistically lower (p 0.05) than that of skin treated with SOS (1 wt%). 14 In addition, the deviation from baseline in in vivo visual skin dryness scores in Table III reveals that SOS (1 wt%) + G (10 wt%) is not different from that of untreated skin (the in vivo control (iii)), and is statistically lower (p 0.05) in visual skin dryness than in skin treated with SOS (1 wt%). Taken together, the TEWL and visual skin dryness results reported in Table III indicate that adding 10 wt% G to an aqueous SOS (1 wt%) solution mitigates the ability of SOS to perturb the skin barrier in vivo. Using dynamic light-scattering measurements to determine the effective SOS micelle hydrodynamic radii in the presence and in the absence of 10 wt% G, we showed recently that SOS micelles are too large to penetrate into the skin aqueous pores in vitro when 10 wt% G is added to the aqueous contacting solution containing SOS (1 wt%) (6). As a result, SOS in micellar form is not able to contribute to SOS skin penetration and associated SOS-induced skin barrier perturbation. Therefore, the in vivo TEWL and visual skin dryness results reported in Table III support the in vitro results reported recently (6) by clearly showing a smaller extent of skin barrier perturbation in vivo induced by 1 wt% SOS in the presence of 10 wt% G relative to that in the absence of 10 wt% G. Although the TEWL and visual skin dryness values reported in Table III indicate that glycerol can indeed mitigate SOS-induced skin barrier perturbation in vivo, a similar corroboration was not obtained using the chromameter measurements of skin erythema (redness). This is because the chromameter scores in Table III indicate no statistical difference (p 0.05) between the erythema scores corresponding to an aqueous contact ing solution containing 1 wt% SOS in the absence of G (0.57 ± 0.11), relative to that in the presence of 10 wt% G (0.58 ± 0.14). It is possible that an aqueous contacting solution containing 1 wt% SOS + 10 wt% G may induce an initial cutaneous reaction that attracts increased blood flow to the dermis of the affected skin site, thereby leading to skin redness, even though the skin barrier may not be significantly perturbed (13- 16,19,22,29,37). Therefore, the skin at the corresponding site may appear red from an increased blood flow to the dermis, without the skin barrier being compromised, which 14 It is important to note that the deviation from baseline of TEWL corresponding to skin treated with an aqueous solution of SDS (1 wt%) + G (10 wt%) is statistically not different (p 0.05) from that corre sponding to untreated skin (the in vivo control (iii)), while it is statistically lower (p 0.05) than that corresponding to SDS (1 wt%) treated skin. This finding provides additional evidence for the ability of glycerol to mitigate SDS-induced skin barrier perturbation in vivo.

618 JOURNAL OF COSMETIC SCIENCE would lead to a higher erythema score. Accordingly, the in vivo erythema response associated with adding 10 wt% glycerol to an aqueous SDS contacting solution on the skin barrier needs to be investigated further. For example, in vivo cutaneous biochemical reaction pathways triggering erythema, which may be triggered by SDS even in the presence of glycerol, could be investigated (13,14,19,37-40). It is also possible that (a) a higher concentration of SDS than the 1 wt% used in the in vivo soap chamber, (b) a higher concentration of glycerol than the 10 wt% used in the in vivo soap chamber, and/or (c) longer exposure times of the in vivo soap chamber may be necessary to discriminate between the in vivo erythema induced by SDS in the presence of glycerol and that induced by SDS in the absence of glycerol. CONCLUSIONS Macroscopic in vitro skin barrier measurements, which quantify the extent of skin barrier perturbation induced by aqueous surfactant-humectant contacting solutions commonly encountered in skin care formulations, can be effectively used to rank these contacting solutions. Such a ranking is based on the ability of the solutions contacting the skin to perturb the skin aqueous pores of the stratum corneum (SC). An in vitro ranking metric was developed using the enhancement in the skin electrical current induced by an aqueous surfactant-humectant contacting solution relative to an in vitro PBS control aqueous contacting solution, as the metric. In vitro mannitol skin permeability measurements, when combined with skin electrical resistivity measure ments, in the context of a hindered-transport aqueous porous pathway model, provided mechanistic insight on the results of the in vitro ranking metric analysis. Specifically, the pore number density (p) and the average pore radius (r p ore ) of the skin aqueous pores induced by aqueous solutions of surfactants and humectants contacting p-FTS were determined. The in vitro skin electrical current/resistivity and mannitol skin permeabil ity measurements were carried out using the following aqueous solutions: (i) an ionic surfactant solution-SDS (1 wt%) (ii) a nonionic surfactant solution-C 12 E 6 (1 wt%) (iii) an in vitro control solution-PBS (iv) a humectant solution-propylene glycol (PG) (10 wt%) and (v) a humectant solution-Glycerol (G) (10 wt%). Utilizing the in vitro ranking metric introduced here, we obtained the following ranking order, from the mildest to the harshest, for the surfactants and the humectants considered above, based on their ability to perturb the skin aqueous pores: (v) 10 wt% G (iv) 10 wt% PG (iii) PBS (ii) 1 wt% C 12 E6 (i) 1 wt% SDS. To substantiate the findings above, in vivo soap chamber measurements were carried out on human volunteers. Specifically, the following in vivo skin barrier measurements were conducted: (a) transepidermal water loss (TEWL) determined by using an evaporimeter, (b) visual skin dryness determined by an expert grader, and (c) skin erythema measure ments using a chromameter. The overall implications of the in vivo results are that the aqueous surfactant solutions i and ii induce a larger extent of skin dryness and erythema relative to the aqueous humectant solutions iv and v. In addition, the in vivo measure ments (a-c) above indicate that a 1 wt% aqueous SDS contacting solution induces the largest extent of skin barrier perturbation, while a 10 wt% aqueous glycerol contacting solution induces the smallest extent of skin barrier perturbation. Both of these in vivo findings are consistent with the results of the in vitro ranking metric analysis. Indeed, the
Purchased for the exclusive use of nofirst nolast (unknown)
From: SCC Media Library & Resource Center (library.scconline.org)