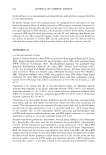
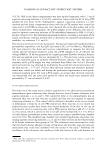
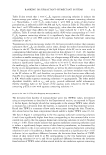
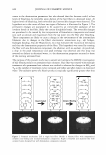
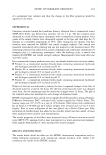
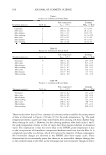
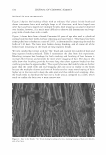
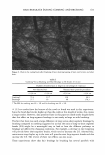
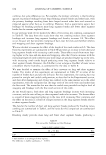
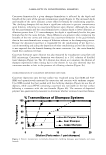
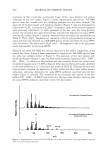
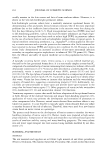
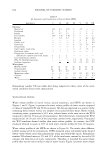
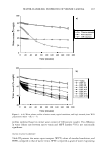
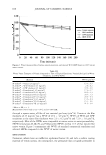
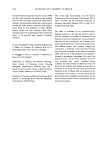
656 JOURNAL OF COSMETIC SCIENCE Table II All Ingredients and Composition of Selected Stable HIPEs Ingredients II III IV V VI VII Oil phase Mineral oil 7.11 6.4 5.61 5 3.5 Petrolatum 5 5 5 Lanolin 2.7 2.7 2.7 2 2 2 2 Cetyl alcohol 3.49 3.49 3.49 Beeswax 1.71 2.5 3 3 4.2 4.2 Sgualene 4 4 4 3.5 Linoleic acid 1 1 1 0.8 Cholesterol 4 5.5 7.5 6 Ceramide III 1 1.5 Capric/capylic triglyceride 2 2 1.5 Cholesterol sulfate Polyglyceryl-4-isostearate (and) cetyl dimethicone copolyol (and) hexyl laurate 2 2 2 Cetyl dimethicone copolyol 1 PEG-30 dipolyhydroxystearate 1.5 1.5 1.5 1.5 Sorbitan sesquioleate 0.5 0.5 0.5 0.5 Water phase Methyl paraben qs. qs. gs. qs. qs. qs. qs. Propyl paraben gs. gs. gs. qs. gs. gs. gs. Sodium chloride 0.7 0.7 0.7 Magnesium sulfate 0.5 0.5 0.5 0.5 Glycerin 7 7 7 5 5 2.5 2.5 Water 70 70 70 70.5 70.5 75 75 Formulation number VII was stable after being subjected to three cycles of the accel- erated condition (freeze-thaw examination). WATER RELEASE PROFILES Water release profiles of native vernix, typical emulsions, and HIPEs are shown in Figures 1 and 2. Figure la presents the water release profiles of native vernix compared to those of standard 0/W and W /0 emulsions. All data are expressed as a percent of the remaining water content within test samples over a period of three hours. Native vernix, containing water, approximately 82% w/w, released water at the same rate as the W/0 emulsion in the first 30 minutes of measurement. After three hours, vernix and the W/0 emulsion lost 19.5% and 14% of the total water content (w/w), respectively. Vernix and the W/0 emulsion showed similar slow water release profiles. In contrast, the 0/W emulsion released as much as 30% of total water content within the first 30 minutes. Water release profiles of the HIPEs are shown in Figure lb. The results show different profiles among all of the preparations. HIPEs prepared using vernix-like lipids showed slower water release rates than preparations using non-vernix-like lipids. Formulation number VII released water at 9% and 21 % of the total water content by the end of 30 minutes and three hours of study, respectively. Therefore, it provided the water release profile that was the most similar to that of native vernix. Figure 2 presents water release

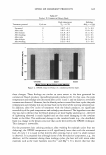
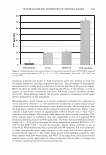
i -� '#. = I- (I) 'ta � i •.-4 (I) '#. = (.) I- 'ta � 100 80 60 40 20 WATER-HANDLING PROPERTIES OF VERNIX CASEOSA 657 a) --0- Vemix caseosa -A- W /0 emulsion ---0--- O/W emulsion 0 ,__ _ __.__ _ __.__ _ ___,�-�-�------.........---------' 0 20 40 60 80 100 120 140 160 180 200 Time (minutes) 100 b) 80 ---o-Vernix ----- HIPE #I ____..,_ HIPE #II 60 ---.- HIPE # III -+- HIPE#IV -+- HIPE#V � HIPE#VI 40 - HIPE#VII 20 .__ _ _.___.....__ _ _._ _ _._ _ _._ _ __. __ ,__ _ _.___.....___....J 0 20 40 60 80 100 120 140 160 180 200 Time (minutes) Figure 1. (a-b) Water release profiles of native vernix, typical emulsions, and high internal phase W/O preparations (mean ± SE, n = 3). profiles replotted based on initial water content of 100 percent weight. The difference in water release rate between native vernix and HIPE number VII is not statistically significant. WATER VAPOR TRANSPORT Table III presents the water vapor transport (WVT) values of standard emulsions, and HIPEs compared to that of native vernix. WVT is reported as gram of water evaporating
Purchased for the exclusive use of nofirst nolast (unknown)
From: SCC Media Library & Resource Center (library.scconline.org)