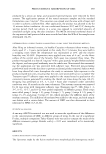
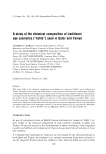
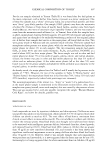
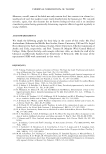
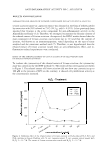
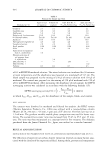
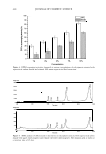
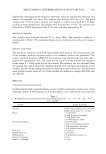
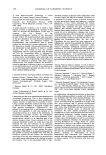
444 JOURNAL OF COSMETIC SCIENCE as chelating agents in the eluent, the net charge on the metal would be reduced, because the chelating agents would be anionic in solution above pKas of the chelating agents. The selectivity of the separation was actually due to the different degrees of association between the metals and the chelating agents that were producing different net charges on the metal complexes. If sufficiently strong chelating agents were used in high concentration, the net charge of the metal complexes could be negative. These anionic metal complexes were separated by anion exchange on the IonPac CSSA column, which allowed metals to be separated as cations and anions on a single column (9). The common chelating agent was oxalic acid, but oxalic acid did not elute the iron. Using this chelating agent, cadmium and manganese were eluted together. From oxalic acid, we could not determine Fe2+, Cd2+, and Mn2+ simultaneously (10,11). In this paper, pyridin-2,6-dicarboxylic acid (PDCA) chelating agent was used for metal separation. PDCA forms strong anionic complexes with most metal ions thus the separation of metals with PDCA on the IonPac CSSA column was an anion-exchange separation. Figure 1 shows that all metals were well separated simultaneously, with better resolution. If this method could be applied to cosmetic samples, it would improve the accuracy of determining toxic metals in the quality control process. OPTIMIZATION OF SPECTROPHOTOMETRIC DETECTION Most hydrated and weakly complexed metals will prec1p1tate in a suppressor and, therefore, cannot be detected by conductivity. Also, with a few exceptions, heavy metals cannot be detected by direct UV absorbance. Therefore, the metal complexing agent was added post-column to form a light-absorbing complex (Dionex Application Note 10, 2000). A number of metal complexing agents were often used for the determination of heavy metals with high sensitivity, e.g., dithizone, 4-(2-pyridylazo)resorcinol (PAR), and 8-hydroxyquinoline-5-sulfonate (HQS) (12). However, dithizone and HQS could not be used under the same conditions for different metals. Consequently, they were not suitable for the simultaneous detection of metals in chromatographic analysis. PAR was used as derivatizing agent because it could produce stable and colorful derivatives with most metals under the same conditions. An optimum flow rate and a concentration combination of PDCA and PAR with a stable baseline and high sensitivity could make 120 mAU 100 80 60 40 20 WVL:530 nm 6-Co 3-Cu 5-Zn Figure 1. Chromatogram of standard metals. Peaks (µg/ml): Pb = 10, Fe = 0.25, Cu = 0.5, Ni = 0.5, Zn = 0.5, Co = 0.5, Cd = 2.5, Mn = 1.0.

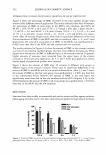
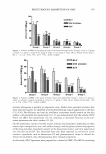
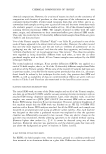
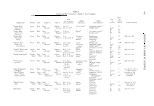
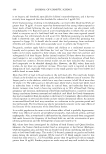
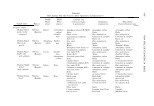
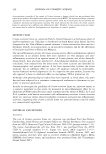
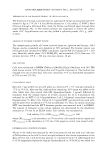
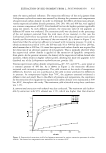
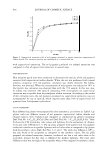
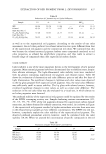
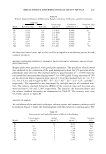
SIMULTANEOUS DETERMINATION OF HEAVY METALS 445 Table II Relative Standard Deviations (RSDs), Linear Ranges, Correlation Coefficients, and Detection Limits RSD (%) Linear range Correlation Detection limit Metal Retention time Peak area (µg ml- 1 ) coefficients (r2) (µg 1-I) Pb 0.210 1.02 2.5--40.0 0.9986 41 Fe 0.166 1.13 0.1-1000 0.9995 3.4 Cu 0.214 1.08 0.1-10 0.9992 5.5 Ni 0.184 0.99 0.1-40 0.9997 6.1 Zn 0.16 1.04 0.2-1000 0.9992 5.8 Co 0.137 1.16 0.2-200 0.9991 3.4 Cd 0.144 1.24 0.8-12.5 0.9988 19 Mn 0.072 0.98 0.2-100 0.9995 9.8 the detection limits lower, and so this could be accepted as a satisfactory process for safe cosmetic products. METHOD VALIDATION (SPECIFICITY, LINEARITY, DETECTION LIMITS, PRECISION, AND ACCURACY [RECOVERY RA TE}) Sharper peaks were produced, with good peak separation. The specificity of each metal was validated by the evaluation of the peak homogeneity from the UV spectrum of the photodiode array detector. The method showed a good linearity (r2 0.999) with the test metals for concentrations ranging from 0.1 to 1000 µg/ml. Using injections of 200 µl, the detection limits (signal-to-noise ratio of 3:1) of this method were 41, 3.4, 5.5, 6.1, 5.8, 3.4, 19, and 9.8 µg/1 for Pb2+, Fe2+, Cu2 + , Ni2+, Zn2+, Co2 + , Cd2 + , and Mn2 + , respectively. The repeatability was determined by multiple analysis of a standard solu tion. The relative standard deviations (RSDs) of the retention time and the peak area were less than 0.21 % and 1.24%, respectively. The linearity, the detection limits, and the relative standard deviations are summarized in Table II. The recovery rates were 97-104%, shown in Table III. ANALYSIS OF SAMPLES As a validation of the analytical technique, coloring agents and cosmetic products could be analyzed. Figure 2 shows the chromatogram of all the metals in a coloring agent. The Table III Concentrations and Spiked Recoveries of Metals in Eye Shadow Concentration Spiked Found Recovery Metals (µg ml- 1 ) (µg ml- 1 ) (µg ml- 1 ) (%) Pb 50 50.56 101.1 Fe 75.7 5 80.31 99.5 Cu 2.55 5 7.38 97.7 Ni 5.76 5 11.04 102.6 Zn 50.34 5 55.82 100.9 Co 0.26 5 5.34 101.5 Cd 5 4.88 97.6 Mn 17.83 5 23.65 103.6
Purchased for the exclusive use of nofirst nolast (unknown)
From: SCC Media Library & Resource Center (library.scconline.org)