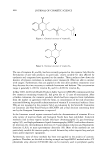
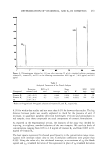
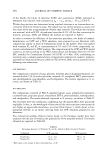
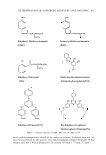
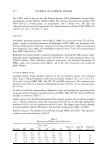
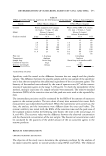
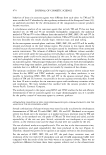
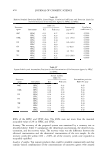
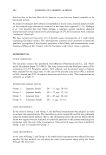
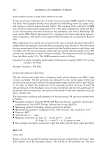
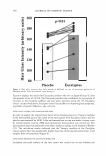
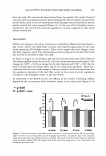
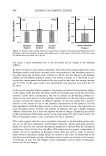
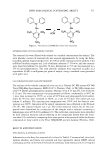
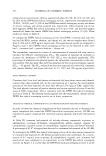
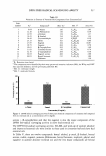
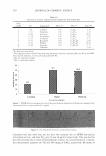
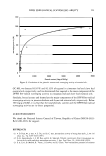
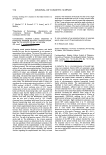
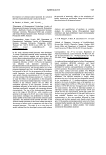
462 JOURNAL OF COSMETIC SCIENCE absence of light. The calibration graphs were obtained by plotting the analyte to internal standard peak-area ratios versus microgram injected of the compound of interest. SAMPLE PREPARATION An aliquot, ranging from 0.2 to 2.0 g of cream, reflecting the possible concentration in the cosmetic sample (obtained as confidential information from the producing firm Laboratoires Auriga, France), was exactly weighed and transferred to a 50-ml volumetric flask. Ten milliliters of dimethylacetamide and then 25 ml of LS. solution were added, and the dispersion was subjected to ultrasonic treatment for 10 min at 3 5 °C. The solution was taken to volume with methanol, and then after filtration on a Millipore filter, an aliquot was injected in the chromatograph. RESULTS AND DISCUSSION Since the cosmetic matrices analyzed are rather lipophylic and variable recoveries of compounds of interest may occur, we decided to quantitate the two vitamins by using an internal standard (LS.). The chosen substance was a UV-A filter, 2,2' -[6-(4-methoxy phenyl)-1,3,5-triazine-2,4-diyl}bis[S-[(2-ethylhexyl)oxy }phenol (INCI name: bis-ethyl hexyloxy phenol methoxyphenyl triazine) whose lipophilicity is intermediate between vitamins K 1 and K 3 . Besides the solubility characteristics, this sunscreen agent displays an absorbance spectrum comparable with that of VKs. The chemical structure of the LS. is shown in Figure 3. As an example, Figure 4 displays a typical chromatogram, obtained at 333 nm, injecting a standard solution containing 800.0 and 80.0 µg/ml of vitamins K1 and K 3 , respectively, and 16 µg/ml of LS. The photodiode array detector allowed the evaluation of the peak purity factors, which are very useful in the analysis of a real sample by confirming both peak purity and peak identification, after a comparison of the values obtained with those of authentic stan dards. The retention volumes, reported in Table I, were reproducible under the experi mental conditions used, and the relative standard deviation (n = 5) was not more than Figure 3. Chemical structure of I.S.

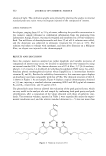
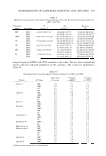
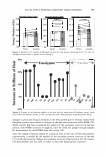
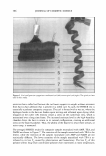
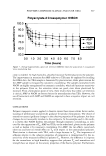
DETERMINATION OF VITAMINS K 1 AND K3 IN COSMETICS 463 mAU ll • �--4,/,,, __ _jl, _____________ �---------------__, ·�-,~-�-·•-- 20 min Figure 4. Chromatogram obtained at 333 nm, after injecting 20 µl of a standard solution containing vitamin K1, vitamin K3, and LS. at the following concentrations: 800.0 µg ml- 1 , 80.0 µg/ml, and 16.0 µg/ml. Table I Analytical Parameters of the Tested Analytes Retention RSD in% Slope LOD LOQ Compound volumesa (ml) area a Intercept (µg- 1 ) R2 (ng) (ng) Vitamin K3 3.45 ± 0.01 0.4 0.040 0.026 0.9994 20 50 Vitamin K 1 27.05 ± 0.06 0.5 0.211 0.005 0.9991 100 250 LS. 22.97 ± 0.5 a Refers to 60-µg/ml and 600-µg/ml solutions of vitamins K3 and Ki, respectively. 0.2% for within-day studies and not more than 0.3% for between-day studies. The big distance between peaks was usually exploited to check for the presence of and, if necessary, to quantitate parabens (detection wavelength: 254 nm) and antioxidants in real samples, since these compounds are usual components of cosmetic formulations. As reported in the Experimental section, the linearity of the assay was checked by injecting, in triplicate, standard solutions of the two vitamins. We used six levels of concentrations ranging from 0.05 to 1.0 mg/ml of vitamin K 1 and from 0.005 to 0.1 mg/ml of vitamin K 3 . The least square regression fits showed good linearity in the concentration range inves tigated, with intercept values close to zero. Correlation coefficients were greater than 0.999. Using the value of a, the calculated intercept, as an estimate of YB (the blank signal) and s y /x (standard deviation of the regression) in place of sB (standard deviation
Purchased for the exclusive use of nofirst nolast (unknown)
From: SCC Media Library & Resource Center (library.scconline.org)