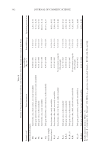
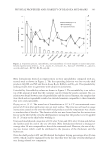
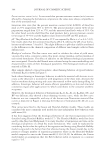
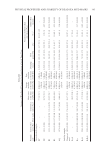
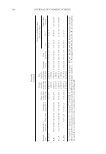
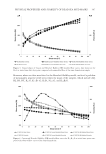
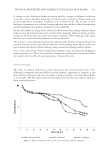
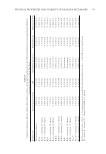
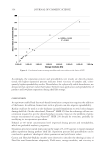
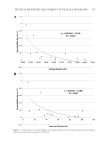
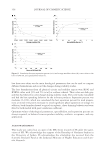
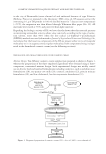
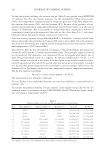
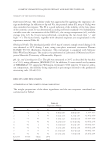
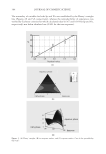
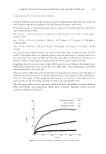
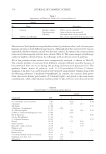
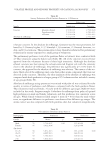
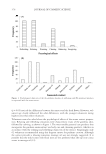
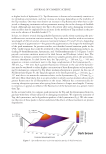
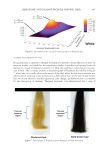
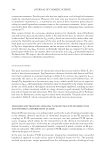
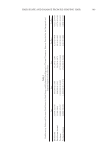
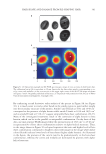
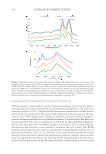
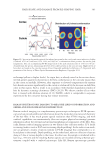
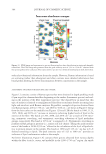
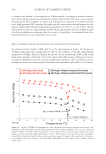
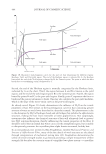
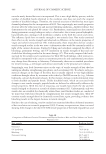
JOURNAL OF COSMETIC SCIENCE 344 Percent moisture content (w/w). It was noted that percent moisture content (w/w) was not affected by changing the formulation composition the values were always comparable to that of the untreated mud. Literature data state that the percent moisture content (w/w) (LOD%) of Dead Sea mud at 25°C ranges from 30% to 40% (5). The percent moisture content (w/w) of our preparations ranged from 32% to 37%, and the untreated mud had a value of 35%. On the other hand, over-the-shelf Dead Sea mud products had a percent moisture content (w/w) range of 34–41% and the highest values observed for RV and NC products. pH. The pH value of the Dead Sea mud at 25°C was reported by Ma’or et al. as 6.4–7.6 (5). Our results show that the untreated mud had a pH of 8, whereas the pH of our formu- lations varied between 7.9 and 8.3. This slight difference in pH value could be attributed to the differences in the chemical composition of different mud samples collected from different sites. Rheological evaluation. The fl ow curves were used to calculate the values of yield stress, viscosity, fl ow index, consistency index, fl ow point, storage modulus, and loss modulus of each tested formulation. The effect of additives on the different rheological parameters was investigated. Over-the-shelf brands were evaluated using the same methodology and characterized in terms of their rheological parameters. The rheological results are sum- marized in Table III. Most samples showed a typical viscoplastic, shear thinning behavior. A typical behavior of formula B10G is shown in Figure 3. Such a shear thinning or thixotropic behavior, in which the material will decrease in vis- cosity as the shear rate is increased or with progression of the shear time, decreases the load on machines during mixing and causes the material to fl ow easily during fi lling. In addition, thixotropic behavior will ensure effi cient spreadability on skin and structural consistency regain after application (3), which contributes to the consumer aesthetic acceptance. However, the rheological behavior of formulations K15G, K7.5B7.5G, K10B2G, NC, and RV was different they showed a shear thinning viscosity curve, while the fl ow curve behavior was not compatible with any of the known non-Newtonian material fl ow curves as depicted in Figure 4 showing the behavior of formulation K7.5B7.5G as an example. Flow curves were fi tted to the Casson and Herschel–Bulkley models. These models are considered the most commonly used models for time-independent fl ow behaviors with yield stress (16). It has been suggested that the rheological behavior of clay water suspensions is best described using Herschel–Bulkley model (17). The Herschel–Bulkley model has been used by Abu-Jdayil and Mohameed (3) to study the effect of temperature and time on the rheological properties of a Dead Sea mask formulation. This could be explained by considering the fact that the quality of the regression and fi tting using Herschel–Bulkley model is expected to be better than that obtained using the Casson model due to the presence of larger number of regression parameters (three in the Herschel–Bulkley model compared to two in the Casson model) (14,16,18,19). In addition, the Casson model makes an assumption that the fl ow behavior index or exponent is a constant equal to “0.5.”

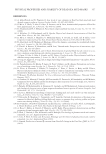
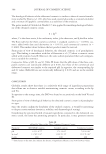
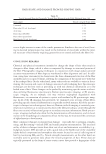
Table III Summary of Rheological Parameters for Formulations at Initial Time Point Formula code Casson yield stress (Pa) Flow index Consistency index (Pa·s) n Shear stress at the limit of LVE (Pa) Storage modulus at the limit of LVE (Pa)of Loss modulus at the limit LVE (Pa) Damping factor Flow point (PA) Viscosity at different shear rate values (Pa·s) 25·s-1 75·s-1 Infi nite shear viscosity Over-the-shelf samples RV – – – 77.10 ± 3.5 8.3E+04 ± 5.2E+04 2.6E+04 ± 1.4E+04 0.29 ± 0.03 186.5 ± 35.8 43.7 ± 2.9 8.14 ± 4.05 – NC 391.1 (0.99) – – 10.74 ± 1.9 1.9E+04 ± 0.071E+040.078E+03 5.3E+03 ± 0.29 ± 0.01 45.3 ± 10.6 25.0 ± 5.3 9 ± 2.9 4.07 ± (0.99) BS 332.1 (0.99) 0.32 (0.95) 103.3 (0.95) 29.25 ± 4.7 2.8E+04 ± 0.37E+04 5.9E+03 ± 0.26E+03 0.21 ± 0.02 69.4 ± 2.4 28.0 ± 12.4 11 ± 4.8 10.24 ± (0.99) BL 434.4 (0.99) 0.37 (0.94) 143.2 (0.94) 46.90 ± 6.6 7.2E+04 ± 0.43E+04 1.8E+04 ± 0.11E+04 0.24 ± 0.00 142.5 ± 16.3 32. 0 ± 3.7 10 ± 1.3 4.52 ± (0.99) AQ 157.6 (0.99) 0.3 (0.96) 66.7 (0.96) 8.86 ± 3.2 8.2E+03 ± 1.5E+03 2.0E+03 ± 0.43E+03 0.25 ±0.01 30.95 ± 2.80 10.0 ± 2.9 4 ± 1.9 2.38 ± (0.99) Stability samples Untreated mud 385.0 (0.99) 0.5 (0.97) 156.3 (0.97) 36.37 ± 5.5 4.4E+04 ± 1.3E+04 1.1E+04 ± 0.24E+04 0.26 ± 0.02 63.03 ± 0.70 38.0 ± 7.8 18 ± 5.3 13.26 ± (0.99)39 K 15 G – – – 88.5 ± 18.1 1.6E+05 ± 0.33E+05 4.3E+04 ± 0.85E+04 0.28 ± 0.00 171.3 ± 15.7 90.0 ± 5.6 17 ± 6.4 – K10 624.4 (0.99) 0.49 (0.99) 398.7 (0.99) 305.5 ± 6.4 6.0E+05 ± 0.26E+05 1.4E+05 ± 0.064E+05 0.24 ± 0.01 598.0 ± 70.7 52.0 ± 6.6 33 ± 6.3 23.7 ± (0.99) B 10 G 556.1 (0.99) 0.28 (0.98) 323.3 (0.98) 27.5 ± 10.1 3.6E+04 ± 1.4E+04 8.6E+03 ± 2.8E+03 0.25 ± 0.03 79.5 ± 17.5 36.0 ± 2.9 16 ± 1.4 8.95 ± (0.99) K5BG5 239.6 (0.99) 0.33 (1.0) 391.6 (1.0) 42.20 ± 0.8 4.8E+04 ± 0.81E+04 1.3E+04 ± 0.23E+04 0.26 ±0.01 118.5 ± 9.2 47.0 ± 4.5 21 ± 1.3 20.11 ± (0.99) PHYSICAL PROPERTIES AND STABILITY OF DEAD SEA MUD MASKS 345
Purchased for the exclusive use of nofirst nolast (unknown)
From: SCC Media Library & Resource Center (library.scconline.org)