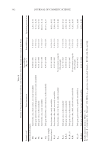
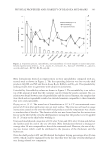
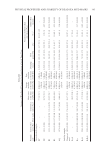
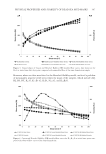
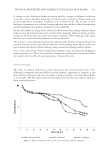
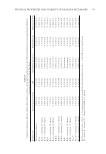
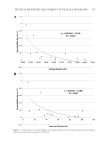
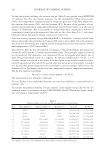
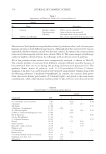
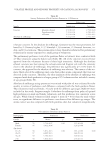
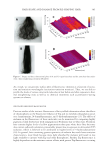
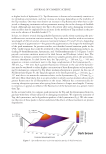
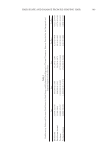
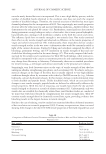
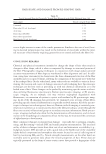
JOURNAL OF COSMETIC SCIENCE 348 Several procedures can be followed to overcome the problem of negative meaningless yield stress values (18), the most applicable one for our samples involves using the Casson model to calculate yield stress for all samples and incorporated the calculated yield stress to the Herschel–Bulkley model and used it to fi t the data to calculate both consistency and fl ow indices. All formulations fi tted to both models with high R2 values except K15G,K7.5B7.5G, K10B2G, RV, and NC, which had negative meaningless values for all or some of the pa- rameters yield stress value (either Casson, Herschel–Bulkley, or both), consistency index, fl ow index, and infi nite shear viscosity. The behavior of K15G, K7.5B7.5G, and RV did not fi t either model, whereas that of NC fi tted to Casson model only and K10B2G fi tted to Herschel–Bulkley model only as shown in Table III. Correlating this deviated behavior with formulation composition revealed that the maxi- mum level of thickener concentration that can be incorporated into a mud formulation without producing a deviation from the ideal shear thinning fl ow curves is 10% of either one thickener (kaolin and bentonite) or a combination of the two of them. Casson yield stress values for our formulations were higher than that of the over-the-shelf samples the highest was that of N0.05G. All in-house prepared formulations mentioned in Table I had higher Casson yield stress compared with untreated mud, except K5B5G. While only BL from over-the-shelf products had higher value than the untreated mud. Yield stress is the minimum shear stress required to initiate material fl ow. It is an impor- tant determinant of the product stability and the ease of product application by the end user (20). Higher yield values ensure that the material will preserve its structure and consistency and maintain particles in the medium with minimal sedimentation (20). On the other hand, lower yield stress guarantees easier distribution of a semisolid on the skin and easier extrusion out of its tube (21). An optimum yield stress value is required to balance between the ability to pump and fi ll the product and the stability during transfer and storage (3). Consistency index values were comparable for most of our stability samples (300– 400 Pa·sn), the highest was that of N0.05G and K10 and the lowest was that of K5B5. All in-house prepared formulations included in the stability study had higher values of consistency index compared with the untreated mud, except K15G and K7.5B7.5G for which could not calculate the consistency index. The consistency index is an indicator of structural strength and serves as an index of the viscosity of the system (14), and when the formulation consistency index is higher, the formulation viscosity, thickness, and yield stress are higher and the lower spreadability is lower. The consistency index of the prepared in-house formulations was higher than that of the over-the-shelf products the lowest value was for AQ brand. Flow index values, an index of the shear thinning tendency of the samples (14), were less than one for all tested samples, which is an indicator of a shear thinning behavior (13). Viscosity value differences were more obvious at lower shear rate (25 s-1) than higher shear rate (75 s-1). The highest viscosities were for K15G, K10B2G, K7.5B7.5G, and K10, while over-the-shelf products had the lower values.

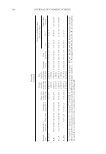
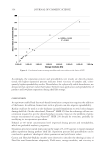
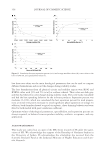
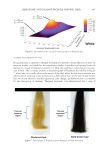
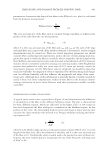
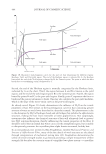
PHYSICAL PROPERTIES AND STABILITY OF DEAD SEA MUD MASKS 349 Oscillatory test parameter values include yield stress at LVE limit, storage modulus, loss modulus, and fl ow point were generally higher for our in-house formulations than NC, BS, AQ, and BL of the over-the-shelf products, while RV had values comparable to in- house formulations. Highest values were for K10, K5B5, and N0.05G, while the lowest were for AQ and NC. The storage modulus (G′) is the energy stored per unit volume, which is proportional to elastic component magnitude in the system contributed by cross-linking and/or aggrega- tion, while the loss modulus (G″) is the energy dissipated per unit volume, which is proportional to the extent of the viscous component contributed by the liquid-like por- tions. The ratio of G″/G′ indicates the strength of interaction of the internal structure and it is called the damping factor (20). The values of the storage modulus were higher than those of the loss modulus for all tested samples, which is a property of elastic systems. The ratio of loss modulus to storage modulus, expressed as the damping factor, was comparable for all samples (ranging from 0.21 to 0.29). Higher formulation elasticity (higher storage modulus values) indicates a higher formu- lation thickness and yield stress and, consequently, a lower spreadability. Shear stress and storage modulus values for in-house samples were all higher than the untreated mud, except for B10G. On the other hand, over-the-shelf products had lower values than the untreated mud, except for RV and BL, which had higher values. A fl ow point is the stress value when G′ = G″, which indicates the stress that will cause structural destruction of the material and consequent material fl ow (15). The higher the fl ow point, the higher stress required to cause material destruction, which could indicate higher product stability over its shelf life. On the other hand, it indicates higher yield stress values and lower spreadability. Only NC and AQ had lower fl ow point values than untreated mud, the remaining over- the-shelf products and all of in-house formulations had higher values than untreated mud. STABILITY OF DEAD SEA MUD MASK FORMULATIONS ON EXPOSURE TO STRESS CONDITIONS The behavior of formulations listed in Table I and stored in plastic jars was investigated on exposure to elevated temperature of 45°C for a period of 4 weeks (accelerated stability study conditions) and freeze–thaw cycling. Samples stored at room temperature (25°C) were used as control samples. Appearance. During stability studies, some formulations showed changes in its appearance at different storage conditions and different time points. Two samples from over-the-shelf products (AQ and BL) had color changes to rusty red after 2 weeks of storage at both room temperature and accelerated conditions, which increased more after 4 weeks at the same conditions. On the other hand, only one formulation (K10) showed color changes to brown and rusty red at room temperature conditions after 4 weeks, and a similar behavior was shown at accelerated conditions, but started after 2 weeks of storage, a rusty red color was observed.
Purchased for the exclusive use of nofirst nolast (unknown)
From: SCC Media Library & Resource Center (library.scconline.org)