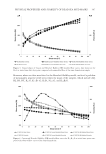
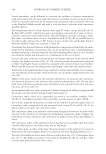
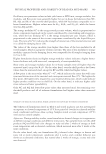
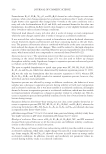
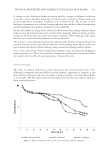
JOURNAL OF COSMETIC SCIENCE 350 Formulations K15G, K5B5, N0.05G, and K10B2G showed no color changes at room tem- perature, while color changes appeared at accelerated conditions after 2 weeks of storage slight brown color appeared that changed after 4 weeks at the same conditions into a rusty red color for formulations K15G and K5B5 and remained brown for the other two formulations. In addition, K5B5G started color changes to a very slightly brownish color after 4 weeks at only accelerated storage conditions. Untreated mud showed a rusty red color after 4 weeks of storage at room temperature while the same changes started after 2 weeks of storage at accelerated conditions. It was noticed that color changes occurred in formulations without hydrated aluminum silicate thickeners (kaolin and bentonite) and those containing kaolin as the sole thick- ener. The presence of bentonite alone or combined with kaolin at the same concentration level reduced the degree of color changes. This could be related to the high adsorption capacity of these materials that could bind whatever species responsible for color develop- ment, which may include iron compounds or carotenoids from Dunaliella (22). Separation percent (w/w). The separation percent test that was used as a tool in formulation screening at the initial development stages (13) was also used to follow up changes throughout stability study. Signifi cant changes in separation percent indicate early prod- uct failure on the shelf after marketing. The most acceptable formulations at initial time point were NC, BS, BL, B10G, K5B5G, K7.5B7.5G, and N0.05G, which were characterized by moderate separation percent (5–10%). AQ was the only one formulation that has extensive separation (10%), whereas RV, K15G, K10, K5B5, and K10B2G resulted in minimal separation percent however, they were thick and not easily spreadable. Separation percent was affected by storage at different conditions, the behavior of most samples was a decrease in separation percent during stability at both room temperature and accelerated conditions, but it was more notable at accelerated conditions all samples showed a decrease in separation percent at accelerated conditions, which was also notable in visual assessment of samples as a change in product texture to a thicker one. The de- crease in separation percent most probably attributed to the loss of water from the formu- lations during storage. Separation behavior after freeze–thaw testing was not clear some samples showed an in- crease in separation percent (RV, NC, BL, K15G, K10, K5B5G, and K10B2G), whereas the remaining formulations (BS, AQ, B10G, K7.5B7.5G, K5B5, and N0.05G) showed a decrease in separation after freeze–thaw cycles. pH values ranged from 7.93 to 8.32 at initial time point and during stability study there was slight variation in pH values (maximum pH change was 0.3 units). Rheological evaluation. Flow curves of K15G, K7.5B7.5G, K10B2G, NC, and RV remained deviated from typical behavior at all the time points and different stability conditions, similar to their behavior at initial time point. The main change in Casson yield stress values during stability was the notable increase at accelerated conditions, while only a slight change was noticed at room temperature stor- age. Some samples, BL and N0.05G, showed a decrease in yield stress on storage under accelerated conditions. In addition, viscosity and oscillatory test parameter values in- creased during stability study at accelerated conditions.

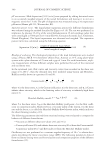
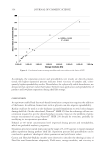
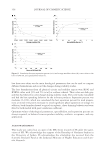
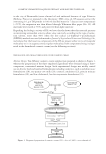
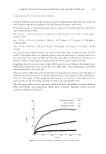
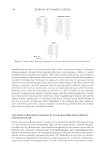
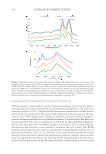
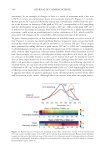
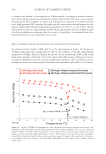
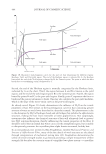
PHYSICAL PROPERTIES AND STABILITY OF DEAD SEA MUD MASKS 351 A change in this rheological behavior during stability storage at different conditions constitute a direct indicative parameter of structure and consistency changes, and gives an early expectation of product instability over its shelf life (8). The increase in most rheological parameters at accelerated testing indicates the stability of these formulations and the minimal risk of product separation over its shelf life. On the other hand, no changes were observed in fl ow index values during stability, which indicates that all formulations preserved their shear thinning behavior during stability testing, at all time points and under all storage conditions. Shear thinning is the target behavior for a semisolid mud preparation as discussed earlier. The increase in most rheological parameter values and the decrease in separation percent could be attributed to the poor barrier effi ciency of the package used, which could cause loss of water and volatile solvents during storage period and change product texture. Freeze–thaw cycling. Freeze–thaw cycling did not produce clear correlations for all physical characterization tests. There was variation in separation and rheological values for differ- ent samples whereas pH and visual appearance remained the same. EFFECT OF ETHANOL The effect of ethanol addition was more obvious at the concentration level of 5%. Although it improved the extrudability and the aesthetic appearance of samples, it also decreased the yield stress and viscosity values as shown in Figure 5 for formulation K5B5, as an example. The fl ow index values of all samples were less than one, which indicates a shear thinning behavior. Figure 5. Effect of ethanol on the viscosity curves of K5B5 at initial time point.
Purchased for the exclusive use of nofirst nolast (unknown)
From: SCC Media Library & Resource Center (library.scconline.org)