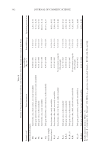
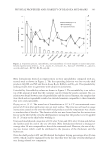
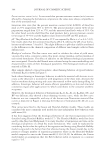
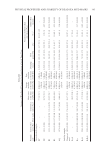
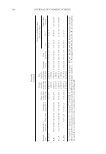
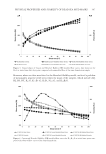
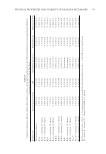
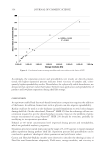
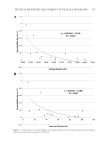
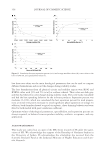
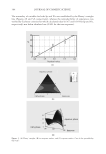
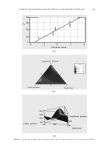
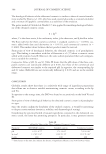
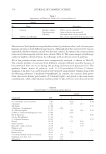
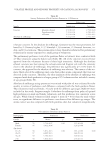
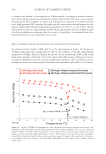
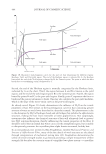
JOURNAL OF COSMETIC SCIENCE 352 In addition, ethanol incorporation improved drying percent of formulations slightly by 2–4%. For example, the drying percent for formulation B10G after 20 min was 16% (w/w). When ethanol 1% was added to the formulation, the drying percent after 20 min became 18% (w/w), while the addition of 5% ethanol resulted in 20% (w/w) drying per- cent after 20 min. On the other hand, there was no clear correlation between ethanol addition and spread- ability results. Extrudability values increased by 5–10% at initial time point when 5% (w/w) ethanol was added to the formulations, except formulation K5B5G, which did not show any change in extrudability values after ethanol incorporation into the formulation. Separation percent increased by 2–4% and loss on drying percent values increased by 1–4% at initial time point when 5% (w/w) ethanol was added to the formulations, while pH changes were not signifi cant. Table IV summarizes the effect of ethanol incorporation into in-house formulations on the results of separation, pH, spreadability, extrudability, and loss on drying tests. Changes during stability study were similar to the changes happened for formulations without ethanol in their composition values of oscillatory tests increased during stabil- ity at both room temperature and accelerated conditions. The apparent change in the results of yield stress and consistency index was an increase in their values at accelerated conditions. In addition, the separation percent results changed on stability and the trend in most samples was a decrease in separation percent at different stability conditions, except K5B5G, which had an increase in separation during stability. Changes in appearance at different storage conditions were similar to those noticed for samples without ethanol. K15G, K5B5, and N0.05G had color changes even when ethanol was incorporated in the formulation composition, while B10G and K5B5G were stable. EFFECT OF DIFFERENT MUD TREATMENT TECHNIQUES Different mud treatment techniques did not cause a clear behavioral change neither at initial time point nor during stability testing, except for the fact that preparations made from the “dry powder” grade had a faint brown color rather than dark gray and higher pH values than those prepared from “untreated mud.” CORRELATION BETWEEN DIFFERENT PHYSICAL CHARACTERIZATION PARAMETERS A linear correlation was observed between the storage modulus and yield stress values at the limit of LVE as shown in Figure 6. Figure 7A and B show the correlation between spreadability and rheological parameters, and Figure 8A, B, and C show the correlation between separation percent and rheological parameters. It is noticed from the fi gures that higher the formulation elasticity (higher storage modu- lus values), higher the formulation thickness and yield stress values, and, consequently, lower the spreadability and separation percent values.

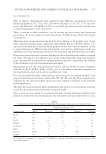
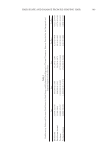
Table IV Summary of Separation, pH, Spreadability, Extrudability, and Loss on Drying Testing Results for the in-House Formulations Containing Ethanol at Different Concentration Levels, at Initial Time Point Formula code a Separation percent (w/w) pH Spreadability (kg·cm·s -1 ) Extrudability (g) LOD percent (w/w) Mud without additives 8.85 ± 0.02 7.97 ± 0.02 0.053 ± 0.008 6.63 ± 0.12 35.25 ± 0.78 K 15 G 2.98 ± 0.41 8.12 ± 0.03 0.025 ± 0.003 5.40 ± 0.16 33.00 ± 0.29 K15G—containing 1% ethanol 4.64 ± 0.20 7.99 ± 0.01 0.059 ± 0.007 5.47 ± 0.28 32.44 ± 0.34 K15G—containing 5% ethanol 6.80 ± 0.90 8.04 ± 0.03 0.029 ± 0.002 15.72 ± 0.40 36.72 ± 0.13 B 10 G 8.02 ± 0.52 7.93 ± 0.03 0.217 ± 0.043 9.17 ± 0.38 35.75 ± 0.19 B10G—containing 1% ethanol 7.37 ± 0.57 7.88 ± 0.02 0.107±0.009 9.17 ± 0.38 36.83 ± 0.57 B10G—containing 5% ethanol 11.09 ± 0.07 8.01 ± 0.01 0.255 ± 0.054 14.63 ± 0.21 37.84 ± 0.03 K5BG5 4.99 ± 0.36 8.24 ± 0.03 0.099 ± 0.010 5.61 ± 0.27 35.83 ± 0.39 K5B5G—containing 1% ethanol 5.46 ± 0.45 8.23 ± 0.08 0.277 ± 0.027 5.96 ± 0.23 37.01 ± 0.08 K5B5G—containing 5% ethanol 8.66 ± 0.25 8.20 ± 0.01 0.250 ± 0.035 6.30 ± 0.17 38.14 ± 0.81 K5B5 4.26 ± 0.95 8.02 ± 0.01 No movement 6.52 ± 0.21 32.45 ± 0.06 K5B5—containing 1% ethanol 4.46 ± 0.24 8.00 ± 0.01 No movement 6.01 ± 0.22 32.66 ± 0.45 K5B5—containing 5% ethanol 5.98 ± 0.36 7.97 ± 0.01 0.114 ± 0.016 11.10 ± 0.46 34.96 ± 0.35 N 0.05 G 7.03 ± 0.88 8.32 ± 0.01 0.180 ± 0.022 7.66 ± 0.34 36.93 ± 0.67 N0.05G—containing 1% ethanol 6.97 ± 0.78 8.28 ± 0.03 0.122 ± 0.011 13.70 ± 0.53 36.19 ± 0.69 N0.05G—containing 5% ethanol 8.90 ± 0.30 8.15 ± 0.07 0.066 ± 0.003 15.40 ± 0.47 37.59 ± 0.36 Results represent mean ± SD (n = 3 for separation percent, spreadability and extrudability tests and n = 2 for LOD percent and pH tests). a K = kaolin, B = bentonite, N = Natrosol 250 HHX, G = glycerin. PHYSICAL PROPERTIES AND STABILITY OF DEAD SEA MUD MASKS 353
Purchased for the exclusive use of nofirst nolast (unknown)
From: SCC Media Library & Resource Center (library.scconline.org)