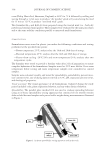
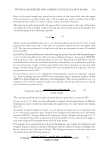
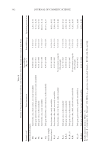
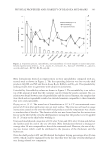
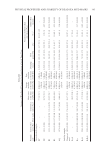
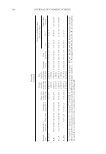
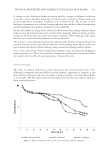
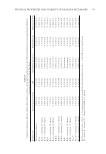
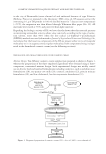
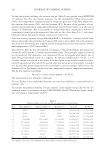
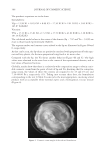
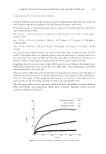
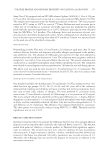
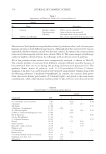
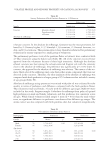
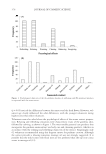
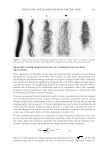
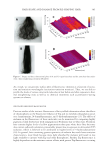
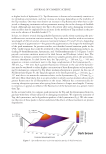
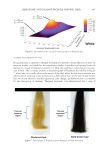
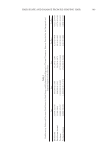
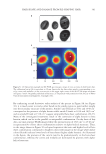
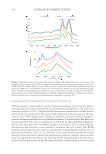
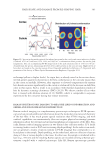
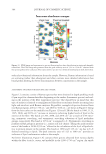
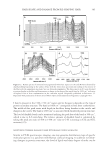
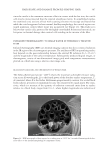
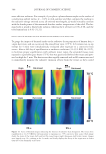
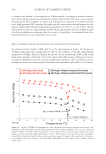
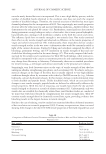
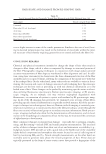
JOURNAL OF COSMETIC SCIENCE 390 of the endogenous biochemical components (proteins, lipids, DNA, etc.) within a tis- sue section without the use of stains or probes. In addition, the vast amount of data inherent in spectral imaging permit sophisticated multivariate analyses such as cluster, principal component, and factor analyses, which enhance the ability to detect altered spatial regions in a heterogeneous sample. Combining univariate analysis and multi- variate techniques provides a unique spectral-structure correlated characterization of biological samples. It has been known for some time that traditional FT-IR spectroscopy is a useful tool for quantifying oxidative damage in hair (22). More recently, FT-IR spectroscopic imaging has been very effective at examining the spatial distribution of specifi c biological mole- cules in hair on the morphological level (23–25). In this section, we demonstrate the ability of these techniques to generate spatially resolved images of hair chemistry, anat- omy, protein distribution, and protein secondary structure information. It can also be employed to map lipid distribution and the conformation in hair. INTERPRETATION OF SPATIALLY RESOLVED FT-IR SPECTRAL IMAGES Utilizing cross sections of human hair, one can map and monitor protein conformation in the morphological sections of the fi ber. Figure 8A contains an optical micrograph of several hair fi ber cross sections, which were subject to FT-IR spectroscopic imaging. The FT-IR image in Figure 8B was generated by extracting the waveband intensity information from FT-IR spectra (from each pixel in the matrix) at 1650 cm-1, which approximates the amide I band corresponding to the protein backbone and identifi es the type of secondary structure (see paragraph below with reference to the band at 1652 cm-1). In one of the hair fi ber cross sections in that image (upper right side), three white pixels are provided as indicators where the spectra shown in Figures 9A, 9B, and 10 were obtained. In Figure 9A, Amide I and II bands are clearly evident in the three major morphological components. These bands, which arise between 1480 and 1750 cm-1, correspond to molecular vibrations in the backbone of keratin protein and are indica- tors of the secondary structure, whether it be alpha helix or beta sheet, or random coil (26). In the cortex and medulla, both peaks are sharp and their position is indicative of alpha-helical conformation. On the other hand, spectra from the cuticle are much broader and point to a greater presence of beta sheets in its structure. Figure 9B con- tains spectra obtained at 2800–3700 cm-1 and correspond to symmetric (2850 cm-1) and asymmetric (2924 cm-1) C–H stretching in the methylene groups of lipids. Another band at 2960 cm-1 is due to C–H stretching in methyl groups of proteins. By taking the peak area ratio of 2850 to 2960 cm-1, we can determine a relative level of lipids in the hair cross sections. Table II Peak Intensity Values and Pertinent Peak Ratios for Dark Brown and Piedmont Hair Exposed to Chemical Relaxer Treatment. Compare These Data with the Untreated Values (Dark brown and Piedmont) in Table I ITrp IKyn I509 ITrp/IKyn I509/IKyn Dark brown-relaxer 19,150 ± 636 108,000 ± 2,828 26,650 ± 1,061 0.177 ± 0.001 0.247 ± 0.003 Piedmont-relaxer 26,150 ± 1,485 2,155,000 ± 35,355 728,700 ± 28,284 0.012 ± 0.000 0.672 ± 0.002

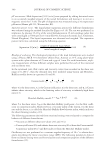
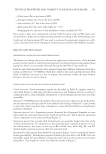
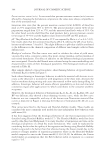
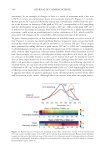
HAIR SHAPE AND DAMAGE FROM RE-SHAPING HAIR 391 By conducting second derivative order analysis of the spectra in Figure 9A (see Figure 10), it is much easier to resolve other bands in the amide region to gain further insight into the secondary structure of the protein. Amide I and II bands at 1652 and 1548 cm-1 correspond to the presence of alpha keratin while amide I bands at 1630 and 1695 cm-1 and an amide II band at 1516 cm-1 suggest antiparallel beta sheet conformation (20,27). Many of the investigated treatments result in the conversion of alpha keratin to beta keratin, which can be in the parallel or antiparallel conformation. On the basis of this data, one may generate FT-IR images where the intensity ratio of 1516 cm-1 to 1548 cm-1 is representative of beta sheet conformation relative to alpha-helical structure. Thus, in the image shown in Figure 10 each pixel represents this ratio and higher levels of beta sheet conformation correspond to brighter colors (red/orange) in the image while darker colors (bluish) indicate lower levels of beta sheets (higher alpha keratin). As illustrated in the fi gure, the proteins of the cuticle tend to be predominantly in the beta sheet conformation, whereas the cortex and medulla are dominated by proteins with alpha- helical structure. Figure 8. (A) Optical micrograph and (B) FT-IR spectroscopic image of cross sections of dark brown hair. The calibration bar in (A) is equivalent to 20 μm. Spectra for the three white pixels—corresponding to cu- ticle, cortex, and medulla—in the cross section in the upper right corner of the (B) FT-IR image are shown in Figures 5 and 6. Originally published in Reference 25. Reprinted with permission of the Society of Photo Optical Instrumentation Engineers, Copyright 2011.
Purchased for the exclusive use of nofirst nolast (unknown)
From: SCC Media Library & Resource Center (library.scconline.org)