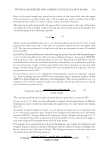
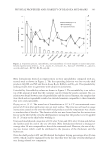
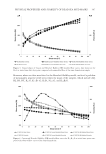
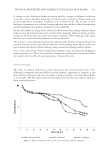
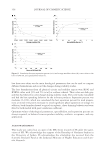
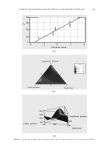
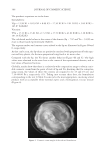
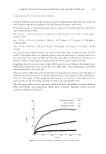
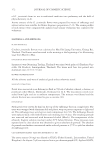
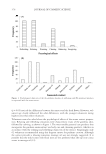
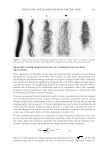
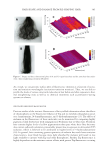
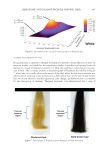
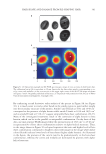
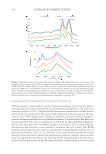
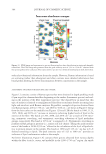
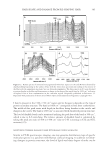
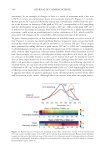
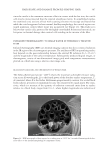
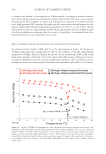
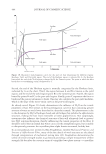
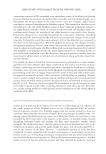
JOURNAL OF COSMETIC SCIENCE 392 MONITORING PROTEIN CONFORMATION IN THERMALLY EXPOSED HAIR Thermal exposure of hair results in surface and internal damage to its structure. This is not surprising since many commercially available thermal styling devices can reach tem- peratures as high as 230°C, well beyond the denaturation temperature of alpha keratin and reaching its melting point. Not surprisingly, and based on the discussion in the pre- vious section, FT-IR spectroscopic imaging is perfectly suited for studying changes in protein conformation brought about by thermal treatments. A detailed look at hair fi ber cross sections exposed to a fl at iron at a temperature of 230°C for 12 min is provided in Figure 11 (Please note that this was a treatment regimen consisting of 12 s per pass with the fl at iron on a hair tress for a total cumulative treatment time of 12 min). This FT-IR spatially resolved spectroscopic image was generated by taking the peak intensity ratio of spectroscopic bands at 1516 cm-1 to 1548 cm-1. (The reader should note that the second derivative curves are used to identify the peak positions however, intensity ratios are taken from the original spectra.) Hence, the resulting FT-IR image provides a measure of the level of beta keratin present in the specimen (with blue corresponding to low levels and Figure 9. Infrared spectra for the white pixel regions in Figure 8B sampled from the cuticle, cortex, and medulla. (A) Spectra in the 1000–1800 cm-1 region of the infrared spectrum corresponding to amide I (1652 cm-1) and II (1648 cm-1) bands. (B) Spectra in the 2800–3700 cm-1 region of the infrared spectrum illustrating the symmetric (2850 cm-1) and asymmetric (2924 cm-1) stretching of C–H bonds in the lipid methylene groups and C–H bonds in lipid methyl groups (2960 cm-1). The peak at 3300 cm-1 in (B) is assigned to N–H stretch- ing in protein. See text for further explanation. Originally published in Reference 25. Reprinted with per- mission of the Society of Photo Optical Instrumentation Engineers, Copyright 2011.

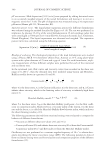
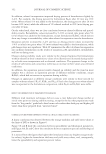
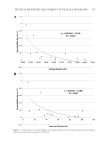
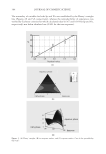
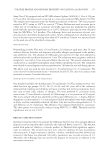
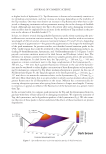
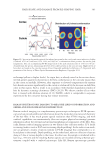
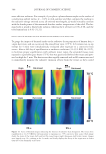
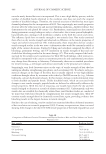
HAIR SHAPE AND DAMAGE FROM RE-SHAPING HAIR 393 red/orange/yellow to higher levels). In virgin hair, as already noted in the section above, we fi nd greater quantities of proteins in the beta conformation in the cuticular region than in the cortex or medulla. However, after exposure to elevated temperatures the amount beta keratin increases signifi cantly in the cortex as evidenced by the decrease in dark blue color in this region. Such a result is in accordance with thermal degradation studies of hair by dynamic scanning calorimetry (DSC) (28,29). We observe similar effects when hair is treated with alkaline solution (0.1% NaOH), which is comparable to exposure experienced by the consumer during hair relaxer treatment. RAMAN SPECTROSCOPIC IMAGING TO MEASURE LIPID CONFORMATION AND ORDER AND DISULFIDE BOND DISTRIBUTION Raman confocal imaging is a complementary spectroscopic technique to FT-IR spectros- copy and can provide additional information about the molecular structure and chemistry of the hair fi ber. It has much greater spatial resolution than FT-IR imaging, and with confocal capabilities can noninvasively (does not require physical sectioning) generate information about the external and internal morphological components of the fi ber. Typ- ically, Raman confocal imaging operates in two distinct data collection modes: X-Y lateral sectioning (surface scan) or X-Z cross sectioning (depth profi ling). In the surface scan mode, one can generate a matrix of spectra (similar to FT-IR imaging) that corresponds to a se- lected plane in the sample. Depth profi ling, on the other hand, refers to collection of spectra along a Z-line at various depths in the tissue. In either case, the sample is irradiated with a laser (e.g., 785 nm) and the resulting Raman spectra are recorded utilizing a Raman spec- trometer coupled with a confocal microscope. Like IR, Raman spectroscopy provides Figure 10. Spectra in the amide region of the infrared spectrum for the cuticle and cortex indicative of alpha (1548 and 1652 cm-1) and beta (1516, 1630, and 1695 cm-1) conformation of hair proteins. See text for peak assignments. Also, an accompanying FT-IR image based on the peak intensity ratio of 1516 to 1548 cm-1 obtained from the spectra, illustrating the level of beta sheet present in the cross sections. Higher levels of beta sheet are found in the cuticular region of hair. Originally published in Reference 25. Reprinted with permission of the Society of Photo Optical Instrumentation Engineers, Copyright 2011.
Purchased for the exclusive use of nofirst nolast (unknown)
From: SCC Media Library & Resource Center (library.scconline.org)