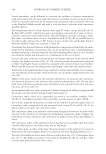
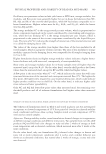
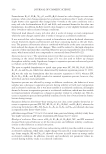
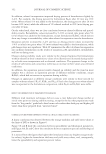
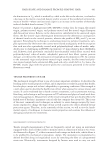
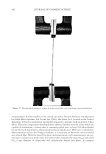
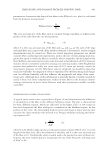
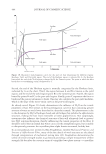
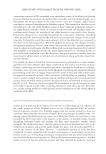
JOURNAL OF COSMETIC SCIENCE 340 pH measurement. Mud dispersions [10% (w/w)] were prepared by adding deionized water to an accurately weighed amount of the tested formulation and leaving it to stir on a magnetic stirrer for 1 h (9). The pH of dispersions was measured using a microprocessor pH meter (Hanna pH 211 Woonsocket, RI). Separation percent (w/w). The liquid phase separation percent for different formulations was evaluated using the method described by Zague et al. (9). The test was performed, in triplicates, by placing 15–20 g of the tested formulations in 15-ml centrifuge tubes that were centrifuged at 3500 rpm for 15 min (K2042 Centurion Scientifi c Ltd., Chichester, United Kingdom). The liquid supernatant was decanted and weighed. The separation percent (w/w) was calculated using the following equation weight of separated liquid phase Separation % w/w = 100 initial weight of sample × (4) Rheological evaluation. The rheological properties of the mud formulations were studied using a Physica MCR 301 rheometer (Anton Paar, Austria) at 25°C using plate–plate system with a plate diameter of 25 mm and a gap of 1 mm. For each formulation, tripli- cate measurements of three different samples were performed for each of the rotational and oscillatory tests. In the rotational tests, fl ow curves and viscosity curves were recorded in the shear rate range of 0–100·s-1, then the obtained data were modeled using Casson and Herschel– Bulkley models shown in equations (5) and (6). Casson model: τ τ η γ 1 1 1 1 2 2 2 2 c c q (5) where τ is the shear stress, τc is the Casson yield point, γ is the shear rate, and ηc is Casson infi nite shear viscosity, which is the limiting value of viscosity at infi nitely high shear rates (13). Herschel–Bulkley model: τ τ γn HB k + × (6) where τ is the shear stress, τHB is the Herschel–Bulkley yield point, k is the fl ow coeffi - cient or consistency index, which serves as a viscosity index of the system, γ is the shear rate and the factor, n, is called the Herschel–Bulkley fl ow behavior index, which indicates the shear thinning tendency (14). The following parameters derived from rotational testing were evaluated to compare the behavior of different formulations. —Viscosity at different shear rate values (25/s and 75/s) —Casson yield stress (Pa) and infi nite shear rate viscosity (Pa·s) from the Casson model. —Consistency index (Pa·sn) and fl ow index (n) from the Herschel–Bulkley model. Oscillatory test was performed at a constant angular frequency of 10·s-1 to obtain rheo- grams describing the linear viscoelastic range (LVE). The following parameters derived from oscillatory testing were used for evaluation and comparison purposes of the different formulations (15).

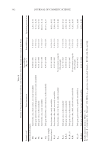
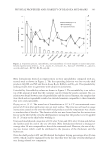
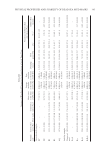
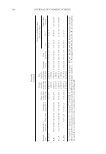
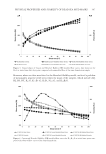
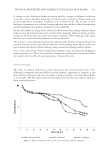
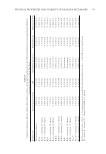
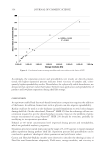
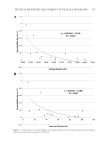
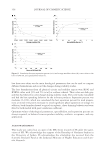
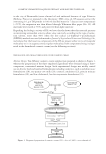
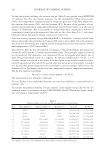
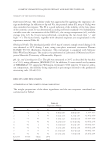
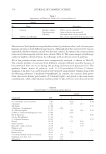
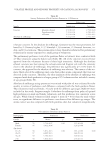
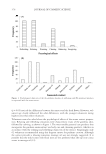
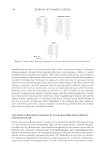
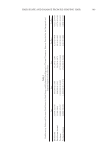
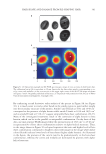
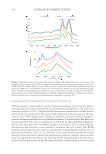
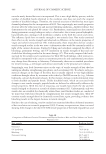
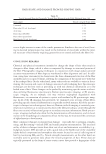
PHYSICAL PROPERTIES AND STABILITY OF DEAD SEA MUD MASKS 341 —Yield stress (Pa) at the limit of LVE —Storage modulus (G′, Pa) at the limit of LVE —Loss modulus (G″, Pa) at the limit of LVE —Flow point (Pa): the stress value when (G′ = G″). —Damping factor: the ratio of loss modulus to elastic modulus (G″/G′) Data analysis. Data were summarized as mean ± SD the mean value and SD values were calculated for a duplicate or triplicate measurements according to the methodology used. Coeffi cient of determination (R2) was used to evaluate the parameters (regression coeffi - cients) calculated from both rheological models (Casson and Herschel–Bulkley models). RESULTS AND DISCUSSION PREPARATION OF DEAD SEA MUD MASK FORMULATIONS Thickeners can change plasticity and alter the application characteristics of the fi nished product and are useful in stabilizing the dispersion of solids and preventing gradual phase separation, which is occasionally observed during the shelf life of clay masks (9). Dead Sea mud mask formulations were prepared using three different thickeners (bentonite, kaolin, and Natrosol® 250 HHX), which were added to the mud in powdered form. This mode of addition was used as a way to disperse the thickener within the mud without having to increase its water content. CHARACTERIZATION OF DEAD SEA MUD MASK FORMULATIONS Visual assessment. Visual assessment results are described in Table II samples varied in color from brown to dark gray and their consistency and thickness varied according to composition from easily extrudable formulations to thick formulations that were not easily extrudable. Natrosol® 250 HHX produced samples with a gritty texture, which may be attributed to the incorporation technique used for slow addition and mixing of Natrosol® as dry powder to the mud, which may have been inadequate to cause effi cient hydration and gelling of polymeric thickener. Separation percent (w/w). Separation percent decreased for all prepared formulas as com- pared with the untreated mud except for B10G and N0.05G, which showed separation values comparable to the untreated mud (Figure 2). Separation percent for over-the-shelf formulations was generally higher than that of the in-house formulations. In comparison to the untreated mud, separation percent of over- the-shelf products was lower in the case of BL and RV only, while AQ, BS, and NC showed higher separation percent than the untreated mud. Spreadability. Glycerin has been shown by our results (Figure 2) to be essential for formu- lation spreadability formulations prepared without glycerin, K10, and K5B5 were not spreadable using the spreadability testing procedure used in this study (no movement using the 0.1 kg weight) as can be seen from the results in Figure 2.
Purchased for the exclusive use of nofirst nolast (unknown)
From: SCC Media Library & Resource Center (library.scconline.org)