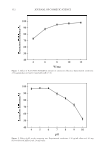
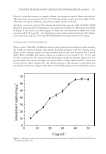
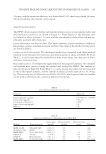
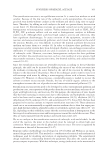
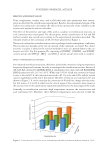
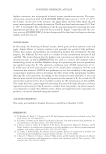
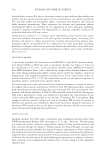
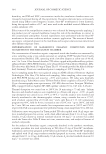
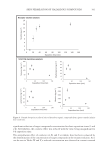
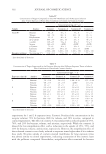
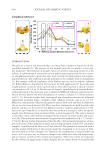
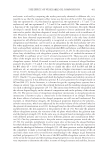
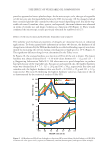
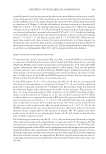
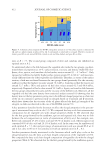
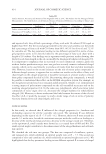
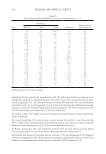
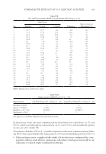
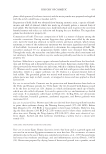
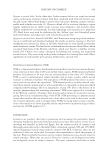
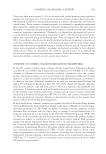
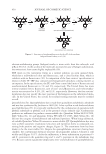
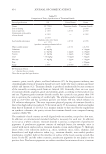
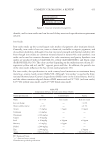
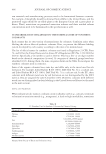
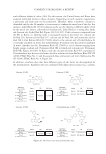
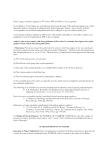
371 SYNTHESIS OF BENZYL ACETATE 4 4 2 2 4 EMIM BF OMIM BF EMIM NTf DEIM NTf EMIM HSO . The catalytic performance in esterification reactions depends on acidity. ILs with strong acidity have high catalytic activity. The formation of the anion in the structure of the IL from an acidic proton-containing component plays an important role in the activation of the reaction. According to the obtained data, [BF 4 ]¯ ˂ [NTf 2 ]¯ ˂ [HSO 4 ] was found to compare anion activities. We can explain this situation according to the degree of acidity of ions. The acidity levels of the anions used were [BF 4 ]¯ ˂ [NTf 2 ]¯ ˂ [HSO 4 ]¯. Hydrogen sulfate ([HSO 4 ]¯) ion shows stronger acidity than [NTf 2 ]¯ and [BF 4 ]¯ anions (67). Accordingly, the highest conversion was obtained when [EMIM] [HSO 4 ] was used. Comparing the cation activities of ILs, the catalytic activity of [OMIM] [BF 4 ] is higher than that of [EMIM] [BF 4 ]. This is because the octyl group in the imidazole ring is more lipophilic (apolar) than the ethyl group. Similarly, the catalytic activity of [DEIM] [NTf 2 ] was higher than that of [EMIM] [NTf 2 ]. Here again, the 1,3 diethyl group is more apolar than the ethyl group, so the dispersibility of ILs is also higher and therefore, may increase catalytic activity (68). In general, it is known that higher conversion efficiencies of acidic catalysts are obtained in esterification reactions (69–71). Chrobok et al. stated that the increase in the mole fraction of H 2 SO 4 in the structure of the catalyst they used increased the yield of the ester (72). Similar results were obtained in our study, and the highest acid conversion value with [EMIM] [HSO 4 ] among ILs was obtained. Therefore, the optimization and modeling results were presented with data from the benzyl acetate esterification reaction performed using this IL as the catalyst. STATISTICAL ANALYSIS The data obtained as a result of the experimental studies using the Box–Behnken method revealed the quadratic model equation in the actual factors shown in the following (Eq. 10): 0 10 20 30 40 50 60 70 80 90 100 [EMIM][BF4] [OMIM][BF4] [EMIM][NTf2] [DEIM][NTf2] [EMIM][HSO4] Type of ionic liquids Figure 6. Comparison of ionic liquids by acid conversion (%). Conversion of acid (%)

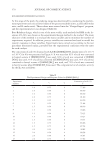
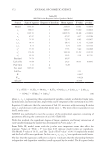
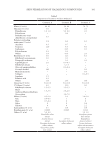
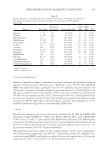
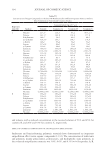
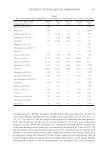
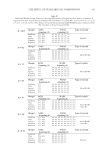
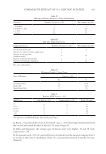
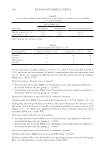
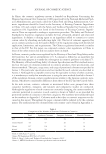
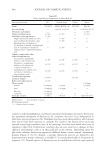
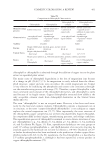
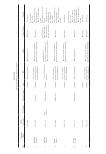
372 JOURNAL OF COSMETIC SCIENCE = - + + + + Y x x x 87.35 11.35x 94.41x – 8.27x 34.12x 2.16x – 2.18x – 11.94x – 87.66x 0.61x 1 2 3 1 2 1 3 2 3 1 2 2 2 3 2 (10) where x 1 , x 2 , x 3 representing three experimental variables, namely acid/alcohol molar ratio, IL molar ratio, and reaction time, respectively and Y (response) is the conversion of acid (%). Equation 10 indicates that the conversion of AA (%) increases with increasing IL molar ratio x 2 and decreases with acid/alcohol molar ratio x 1 . The most effective parameter was the IL molar ratio. ANOVA was performed to test the accuracy of the polynomial equation consisting of parameters affecting the conversion of acid (%) (Table III). With this method, the significant degree of linear, quadratic and binary interaction of each variable forming the model was determined by F-test and p F. From Table III, model terms with the p-value were important terms that affect the response. Values of “Prob F” less than 0.05 indicate model terms are significant. The Model F-value of 19.51, and The “Lack of Fit F-value” of 90.33 implied the model and the Lack of Fit was significant. In this case x 1 , x 2 , x 1 x 2 , x 2 2 are significant model terms. The fact that the regression coefficient is close to 1 indicates that the relationship between independent and dependent variables is well expressed by the model. The R-squared value Table III ANOVA for the Response Surface Quadratic Model Source Sum of squares Degrees of freedom Mean square F-value p-value Model 1926.26 9 214.03 19.51 0.0004 x 1 588.07 1 588.07 53.60 0.0002 x 2 1005.76 1 1005.76 91.68 0.0001 x 3 47.97 1 47.97 4.37 0.0748 x 1 x 2 72.76 1 72.76 6.63 0.0367 x 1 x 3 18.71 1 18.71 1.71 0.2329 x 2 x 3 4.75 1 4.75 0.43 0.5315 x 1 2 37.55 1 37.55 3.42 0.1068 x 2 2 126.39 1 126.39 11.52 0.0115 x 3 2 25.25 1 25.25 2.30 0.1730 Residual 76.79 7 10.97 Lack of fit 75.68 3 25.23 90.33 0.0004 Pure error 1.12 4 0.28 Cor. total 2003.06 16 Std Dev. 3.31 R2 0.9617 R2 adj 0.9124 Adeq R2 16.556
Purchased for the exclusive use of nofirst nolast (unknown)
From: SCC Media Library & Resource Center (library.scconline.org)