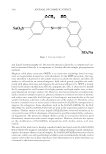
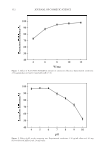
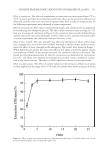
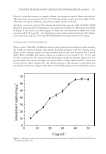
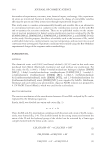
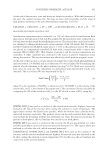
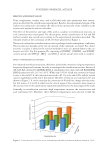
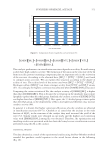
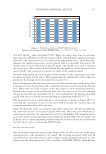
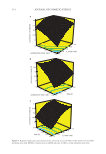
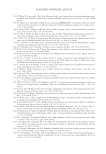
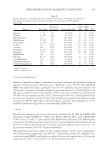
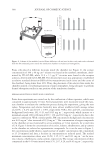
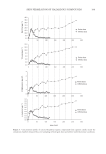
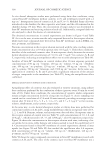
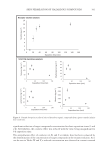
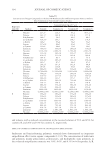
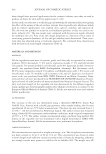
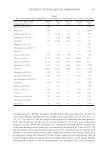
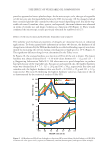
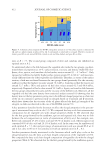
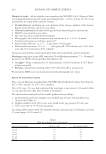
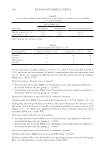
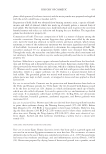
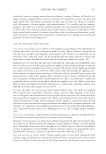
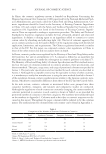
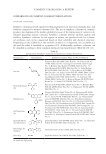
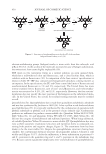
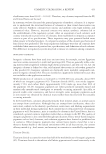
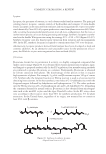
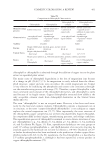
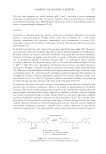
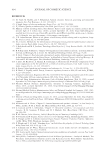
408 JOURNAL OF COSMETIC SCIENCE In Figure 2B, the oil loss of the oleogels as a function of R for the four oils is shown. All the values are presented in the Supporting Information Table SI.2. We observed the same global trend for all oils. The oil loss for pure BO (R = 10:0) was around 4%. By adding BA (R = 8:2 and R = 7:3), a decrease in the oil loss was observed for all the samples. The minimum values of oil loss were obtained for R = 8:2 and for R = 7:3 for apricot and rapeseed oils. Whereas the minimum values for the same parameter for olive and camelina oil were R = 8:2. Then, by increasing the amount of BA from R = 5:5 to R = 0:10, the oil loss increased for all the oleogel systems. The highest oil loss was reached for R = 0:10 corresponding to pure BA in oil. By combining the results obtained for the hardness of the oleogels and their so-called oil-binding capacity and by applying statistical analysis, we observed two different behav- iors (Table SI.1 and SI.2). Apricot and rapeseed oils exhibited an optimal R at 7:3 in terms of oleogels properties such as observed in our previous study for sunflower oil, whereas the optimal R appeared for the ratio 8:2 for olive and camelina oils (27). It is important to notice that the maximal values for the hardness and the minimum values for oil loss varied as a function of the oil (Table SI.1 and SI.2). This observation showed that for a given R the nature of the oil also had an impact on oleogel properties. We supposed that the polarity, viscosity, density, surface tension, presence of polar minor components in different amount as well as fatty acid chain length composition could explain this result (34–39). EFFECT OF THE OIL ON THE THERMAL BEHAVIOR OF THE OLEOGELS Another important parameter for industrial applications is the thermal behavior of the oleogels. In order to determine the effect of the oils on the thermal behavior of the oleo- gels as a function of R, DSC measurements were performed for all the oleogels. For all the oils, the same melting and crystallization behaviors were observed as function of R. The typical DSC curves for camelina oil are presented in Figure SI.1. For all R and oils, one major peak was observed during both the crystallization and the melting, except for R = 3:7 and R = 2:8 showing an additional secondary peak on their profiles at lower temperatures than the main peak (Figure SI.1). We supposed that two different 48 50 52 54 56 58 60 62 64 BO:BA ratio (w:w) Olive Apricot Camelina Rapeseed 10:0 8:2 5:5 3:7 2:8 0:10 7:3 Figure 3. Main melting temperature of oleogels as a function of R between behenyl alcohol:behenic acid (BO:BA) in various oils: olive (green circle), apricot (red diamond), camelina (brown square), and rapeseed (blue triangle). Peakmetng empeaue(C)

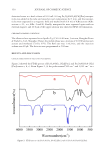
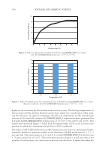
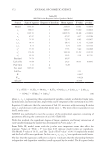
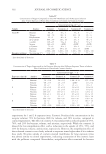
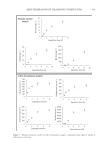
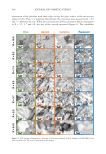
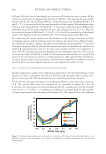
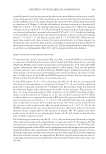
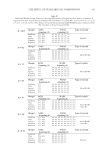
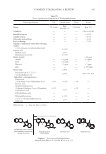
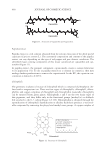
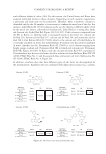
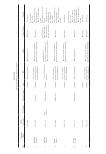
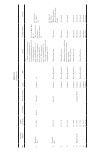
409 THE EFFECT OF VEGETABLE OIL COMPOSITION crystalline particles species were present for these ratios with different melting and crystalli- zation temperatures (19,20). The same behavior was observed that has previously been seen for the sunflower oil (27). For all the oleogels, the evolution of the melting peak was plotted as a function of R (Figure 3). All the oils exhibited the same evolution as a function of R (Table SI.3). For R = 10:0, the melting temperature was around 55°C. The lowest melting temperature was reached for R = 8:2. By increasing R, an increase of the melting temperature was observed and reached a maximal value around 62°C for R = 0:10. For the total enthalpy of the endotherm, we observed the same trend for all oleogels: a decrease of the total enthalpy from R = 10:0 to R = 3:7 and then an increase until R = 0:10 (Table SI.3). When we com- pared these results with those obtained for stearyl alcohol/stearic acid based oleogels, we observed the same trend (42). This variation of enthalpy as a function of R was attributed to the formation of mixed crystals in the systems (16). For the thermal behavior of the oleogels, no oil effect was distinguished (Table SI.3). All the oleogels had the same behavior. EFFECT OF THE OIL ON THE CRYSTAL STRUCTURE To determine the crystals’ nature (pure BO, pure BA, or mixed BO/BA) for each oleogel as a function of both R and the nature of the oil, Small and Wide-Angle X-ray scattering (SAXS and WAXS, respectively) measurements were performed at 25°C. From the SAXS regime, information about long spacing linked to chain length, chain tilt and number of chains per layer can be obtained. From the WAXS regime, information related to the short spacing can be obtained corresponding to the lateral packing of the chains. In Fig- ure 4, all the spectra in the SAXS and WAXS regimes are shown. All the d-spacings are shown in Table II with the nature of crystalline structure. In the SAXS regime, for R = 10:0 containing only BO, for all the oils, one main peak was detected corresponding to a d-spacing of around 57.1 Å and another additional peak with a d-spacing of around 48.3 Å (Figure 4A). Each of these peaks was followed by additional higher order reflections peak visible on the spectrum. The presence of these two long d-spacings indicated the coexistence of two different packing arrange- ments as already reported by Valoppi et al. for fatty alcohols in peanut oil (43). Based on the literature, it is supposed that some of BO molecules were crystallized in a double layer structure associated with d = 57.1 Å (43). The other BO molecules were organized into a triple layer structure with a d-spacing around 100 Å that can be deduced from the position of the second order reflection peak observed at d = 48.3 Å (19). In the WAXS region for all the oils, six peaks were detected, which were almost at the same position except a slight shift for the rapeseed oil (Figure 4B). We suppose that these peaks can be ascribed to two polymorphic forms, the β’ and γ-form as described for fatty alcohols in peanut oil (43). For all the oleogels containing only BA (R = 0:10), only one main peak followed by its higher order reflections was detected corresponding to a d-spacing of 48.3 Å. We suppose that BA molecules were crystallized in a double layer structure associated with d = 48.3 Å. Other addi- tional peaks appeared on the SAXS curves coming from some polymorphic structures present inside the oleogels at low concentration. In the WAXS regime, five peaks were detected corre- sponding to the main crystalline structure present inside the oleogel (Table II). By comparing this result with the literature, we supposed that BA in the oleogels showed only one molecu- lar packing arrangement and crystallized into the most stable C form with a monoclinic unit cell (44).
Purchased for the exclusive use of nofirst nolast (unknown)
From: SCC Media Library & Resource Center (library.scconline.org)