36 JOURNAL OF COSMETIC SCIENCE
to reduce their carbon footprint, notably via the Science Based Targets (SBTi) initiative
[16], and report progress via the Carbon Disclosure Project (CDP) Climate [17] and
Company Sustainability Reports. The approach to calculating the carbon footprint within
the chemical industry is favouring the recommendations of Together for Sustainability
(TfS) [18] methodology as a sectorial standard over the historic Product Environmental
Footprint (PEF) methodology – even if PEF is still the standard EU Commission reference
methodology. An essential element of TfS is the explicit biogenic or plant sourced carbon
footprint discount that can be allocated, a critical lever for reducing carbon footprint. As
discussed by Warr et al [14] Scope 3, the contribution from the manufacture of fragrance
raw materials, dominates the overall fragrance oil footprint and three key strategies to
reduce carbon footprints were discussed:
– Reduce level of use of fragrance by compaction lower levels of more intense fragrances
typically have lower “in product” carbon footprints.
– Replace virgin fossil by renewable carbon (today plant, tomorrow perhaps recycled
fossil) in the most favourable cases this can reduce footprint by 3 kgCO
2 e/kg for an
ingredient if the biogenic contribution is allowed.
– Avoid materials with the highest carbon footprints there is a x100 factor between
materials with the lowest and highest footprints.
A factor not considered in the earlier article but with increased granularity should now be
highlighted is the contribution of Land Use Change (LUC) and Land Management (LM)
for certain natural extracts [19]. LUC and LM are part of Forest, Land and Agriculture
(FLAG) emissions which are often requested to be reported separately. LUC is a penalty
if the land used for cultivating the plant material was deforested in the last 20 years. The
impact depends largely on the land area used for cultivation, the change in land use, and
the eventual yield of the natural extract. For certain natural extracts, this can have a major
impact and drive the overall footprint for the material. As the default value for LUC will
be linked to the country/region, the only way to avoid the LUC penalty is either to have
evidence that the land used was not deforested in the last 20 years, or eventually to consider
another source or source country where LUC has not occurred. In conclusion, an additional
fourth key strategy should be:
– Avoid natural materials with a high FLAG contribution.
The above four strategies, in collaboration with customers can significantly reduce the
carbon emissions linked to fragrance oil production and use. Nevertheless, the goal of
attaining the Green Deal goal of carbon neutrality for the EU by 2050 remains challenging.
Several companies in the fragrance value chain have signed The Climate Pledge [20] with
the more ambitious objective of carbon neutrality by 2040 through eliminating, reducing
or offsetting carbon emissions. Of the four strategies, reducing level of use by compaction
is likely to have the biggest impact [14], followed by replacing virgin fossil carbon. Given
that successful fragrances can have multi-year lifetimes, using “maintenance” occasions
such as safety reworks to also reduce carbon footprint is likely to be a key strategy to reduce
the industry’s carbon footprint.
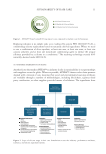
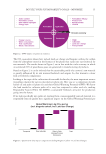
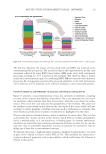
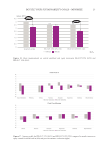
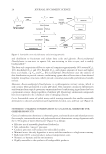
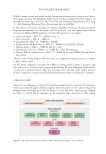
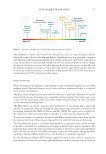
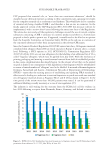
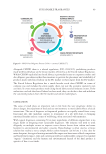
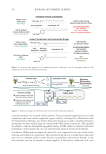
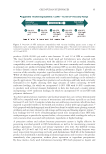
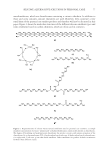
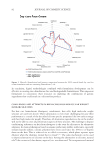
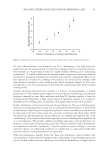
A very rough characterisation of the carbon footprints of fragrance raw materials by broad
categories is indicated in Figure 4 below note that amongst the 100s of raw materials used
there will be many examples that do not fit this schematic. It should also be noted that whilst
the number of suppliers providing carbon footprint data for their ingredients is increasing
there is still a lack of primary data across the broad range of ingredients used by the industry.
to reduce their carbon footprint, notably via the Science Based Targets (SBTi) initiative
[16], and report progress via the Carbon Disclosure Project (CDP) Climate [17] and
Company Sustainability Reports. The approach to calculating the carbon footprint within
the chemical industry is favouring the recommendations of Together for Sustainability
(TfS) [18] methodology as a sectorial standard over the historic Product Environmental
Footprint (PEF) methodology – even if PEF is still the standard EU Commission reference
methodology. An essential element of TfS is the explicit biogenic or plant sourced carbon
footprint discount that can be allocated, a critical lever for reducing carbon footprint. As
discussed by Warr et al [14] Scope 3, the contribution from the manufacture of fragrance
raw materials, dominates the overall fragrance oil footprint and three key strategies to
reduce carbon footprints were discussed:
– Reduce level of use of fragrance by compaction lower levels of more intense fragrances
typically have lower “in product” carbon footprints.
– Replace virgin fossil by renewable carbon (today plant, tomorrow perhaps recycled
fossil) in the most favourable cases this can reduce footprint by 3 kgCO
2 e/kg for an
ingredient if the biogenic contribution is allowed.
– Avoid materials with the highest carbon footprints there is a x100 factor between
materials with the lowest and highest footprints.
A factor not considered in the earlier article but with increased granularity should now be
highlighted is the contribution of Land Use Change (LUC) and Land Management (LM)
for certain natural extracts [19]. LUC and LM are part of Forest, Land and Agriculture
(FLAG) emissions which are often requested to be reported separately. LUC is a penalty
if the land used for cultivating the plant material was deforested in the last 20 years. The
impact depends largely on the land area used for cultivation, the change in land use, and
the eventual yield of the natural extract. For certain natural extracts, this can have a major
impact and drive the overall footprint for the material. As the default value for LUC will
be linked to the country/region, the only way to avoid the LUC penalty is either to have
evidence that the land used was not deforested in the last 20 years, or eventually to consider
another source or source country where LUC has not occurred. In conclusion, an additional
fourth key strategy should be:
– Avoid natural materials with a high FLAG contribution.
The above four strategies, in collaboration with customers can significantly reduce the
carbon emissions linked to fragrance oil production and use. Nevertheless, the goal of
attaining the Green Deal goal of carbon neutrality for the EU by 2050 remains challenging.
Several companies in the fragrance value chain have signed The Climate Pledge [20] with
the more ambitious objective of carbon neutrality by 2040 through eliminating, reducing
or offsetting carbon emissions. Of the four strategies, reducing level of use by compaction
is likely to have the biggest impact [14], followed by replacing virgin fossil carbon. Given
that successful fragrances can have multi-year lifetimes, using “maintenance” occasions
such as safety reworks to also reduce carbon footprint is likely to be a key strategy to reduce
the industry’s carbon footprint.
A very rough characterisation of the carbon footprints of fragrance raw materials by broad
categories is indicated in Figure 4 below note that amongst the 100s of raw materials used
there will be many examples that do not fit this schematic. It should also be noted that whilst
the number of suppliers providing carbon footprint data for their ingredients is increasing
there is still a lack of primary data across the broad range of ingredients used by the industry.