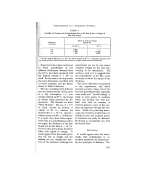
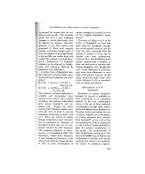
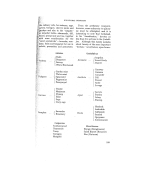
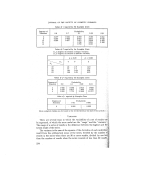
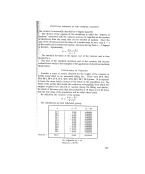
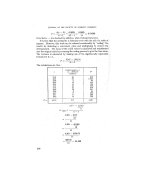
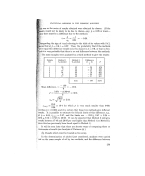
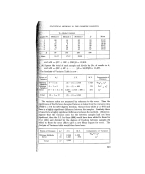
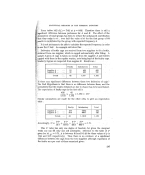
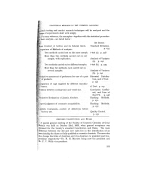
'JOURNAL OF THE SOCIETY OF COSMETIC CHEMISTS Source of Variance , Between Methods Within Methods Total Degrees of Freedom No.' of Methods -- 1 -----2 17 -- 2 = 15 , No. of Individuals --1=I7 Sum of Squares (3) - C.T. = 2,058 3,285 --' 2,058---- 1,227 (2) - c.r. = 3,285 Mean Square col. 3 .'-- col. 2 1,029 81.8 Components of Variance •2 The Between Methods Mean Square may or may not be significantly different from the Within Methods Mean Square, .and. this is estimated by means of the F test in which the Mean Square for Between Methods is dividei :, by that Within Methods to give the Variance ratio, E. This is 1,029/81'8 -- 12-6. Reference to tables of F, with N• the degrees of freedom of the larger Mean Square (two) and N,. the degrees of freedom of the smaller lVIean Square (fifteen), shows that at p = 0'001, F has a value of 11.3. Our value is greater than this, showing the probability that the value found would be obtained':71 as a matter of chance to be less than 0.001 meaning that there is little doubt that there is a significaht difference in the variance between methods when compared with the var/ance within methods. The internal "Within Methods" component of the Variance (= %" 81.8) is the me•ure of the error of the determinations, whilst the = :½ ..
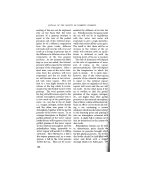
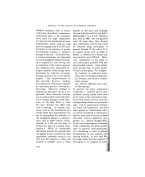
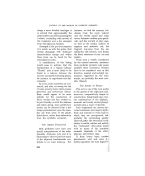
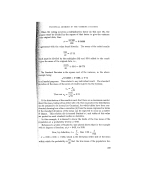
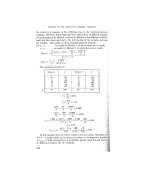
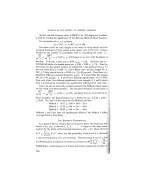
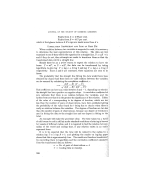
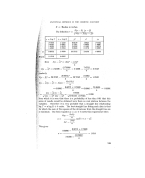
"Between lVIethods" component of variance (na n' q- a•' = 1,029) gives the variance i! .. due to the method. For the latter we have: 6=• 2 + 81.8 = 1,029 . .'.a• • -- 158. The total variance of the sample is the sum of that due to method, a'- -- 158 and that due to error, %• = 82. It is apparent that variance due to the method makes a bigger contribution to the total variance/• than does that due to the error. If it is desired' to know the true alcohoF• content of the oil, more improvement would be given by steps taken ti5 : * reduce the variance between the methods than by reduction oI the error inherent in any one method. (b)'In the t test, section (a), the alcohol was determined by each of "methods, on six samples. To make most use of the data, it can be analys•e ( to show the variance due to the Method, to the Sample and to the Errol: The results are as shown in table opposite ß • ß giving the-calculations' " 436' (1) Correction Term -- -- -- 10,561. ß (2) Squar• each individuk['and add ' 26" q- 82 q- ....... (3) Square the total of each Method and divide by No. of results :i: 242

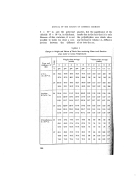
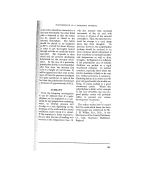
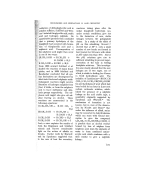
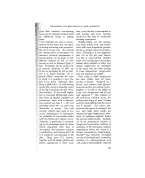
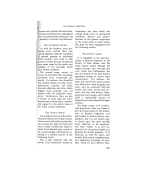
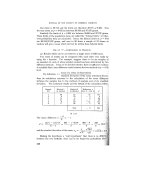
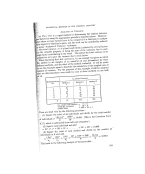
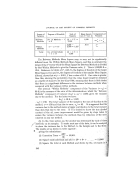
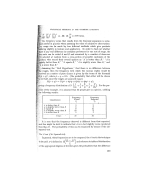
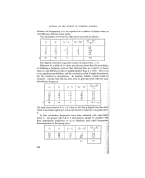
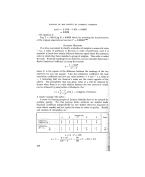
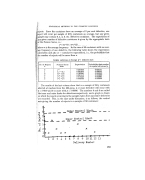
STATISTICAL METHODS IN THE COSMETIC-INDUSTRY •mPle No. Method 1 Method 2 Method 3 2 Mean •i!• 2• 15 s2 •3 31.00 ?71:. 2 8 lO 24 42 ,4.00 i :•/ 5•i? ' :, 3 14 6 35 -- 55 18-33 • [• (• •: 4 24 31 43 98 32.67 ?. '- ,7 .i '•5•:•::. ß • 97 103 236 436 •:• Mean 16.17 17-17 39.33 •?i-11:•:'and add = (97 • q- 103' q- 236')/6 = 12,619. Square the total of each sample and divide by No. of results in it, and add = (93' q- 42' q- ...... )/3-- 34,372/3---- 11,457. Analysis of Variance Table is now' i::!•i•rce of .' d.f. ' S.S. gI.S. Components of ? Variance Variance etween' 3 -- 1 = 2 .(3) -- (1) = 2,058 1,029 6a,, • _{_ 0'• 2 :Be•een 6 -- 1 = 5 (4) -- (1) • 896 179 3as • • %• •:.• •mples • : E•or 17- 2 - 5 = 10 3,285 - 2,058 - 896 = 33.1 ' %• • •o•l 18- I: 17 (2) --(1) : 3,285' The variance ratios are measured by reference to the error. Thus the of the Between Samples Variance is taken from the variance ratio .79/33'1 ----- 5'4 for 5/!0 degrees freedom, whence from tables p -- 0-0! and is a highly significant difference between the samples. Similarly there is found to be a highly significant difference between the methods. (However, that the variance ratio for the between samples had not been then the S.S. for these (896) would have been added to those for (331) and divided by the degrees of freedom between samples (5) to those for error (10) to give a new Mean.Square for error. The nalysis of Variance table would then have been :' Source of Variance d.f. S.S. M.S. Components of Variance Between Methods 2 2,058 1,029 6am' + a• Error 15 1,227 37.2 a• • Total I 17 3,285 _ ß I • 243
Purchased for the exclusive use of nofirst nolast (unknown)
From: SCC Media Library & Resource Center (library.scconline.org)