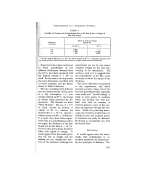
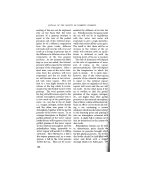
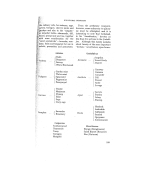
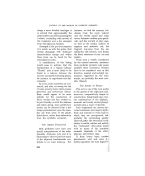
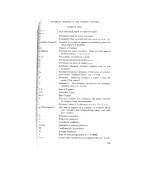
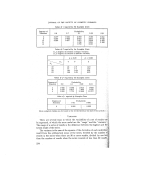
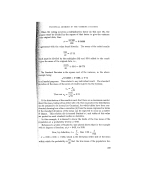
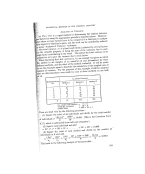
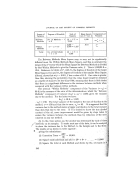
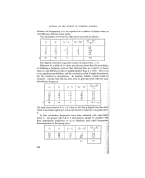
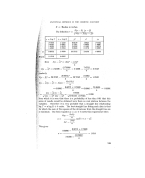
JOURNAL OF 'THE SOCIETY OF COSMETIC CHEMISTS between the frequencies is to be expected as a matter of chance when no real difference between them •xists. , v. The calculation of x• from the data above proceeds as follows ' 3 2 1 1 0.5 6 8 -- 2 4 '' 0.5 8 !2 , -- 4 16 1-33 10 8 . 2 4 0.5 5 2 3 9 4,5 32 32 0 7.33 ,. The degrees of freedom equal the number of classes less 1, -- 4. 'Reference to a table of X 3 values (see above) shows that the probability of obtaining a frequency such as that observed here as a matter of chance' when no real difference exists is slightly greater than p = 0-10. This is not a very significant probability, and the conclusion is that B might be preferred,: but the evidence is inconclusive. In practice, further results would be obtained. Assume that this has been done to give 64 results with the same distribution frequency. fe - I (io (fø - ,, 6 . 4 2 [ 4 1.0 12 16 -- 4 16 1.0 16 24 -- 8 64 2.7 20 16 4 16 1 '0 10 4 6 36 9.0 14'7 64 64 0 I , The table shows that at 4 d.f. a X 3 value of 14.7 has p slightly less than which is decidedly significant and shows that A. In this calculation frequencies have been obtained with expectati 'f? below 5. All groups with below 5 observations should be classified wit•:'ii their appropriate neighbours so as to eliminate such small frequencieS.!:i: Rearrangement of the group gives ß . , 18 20 -- 2 4 0.2 16 24 -- 8 64 2.7 30 20 lO 100 5-0 7.9 , 246

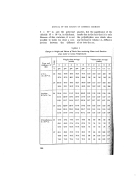
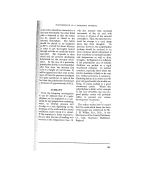
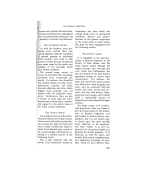
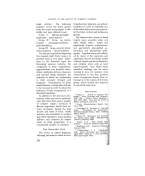
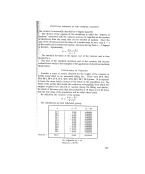
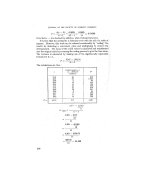
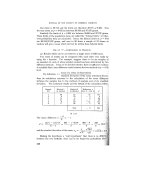
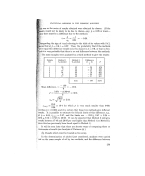
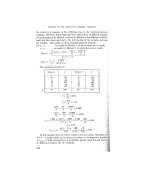
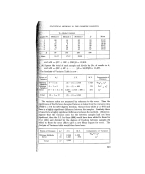
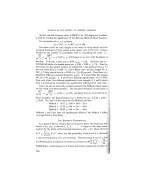
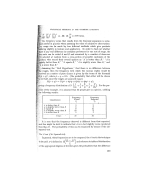
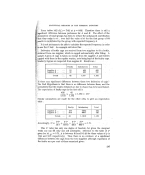
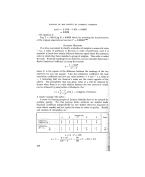
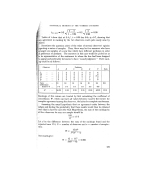
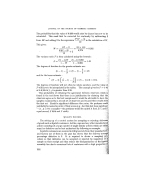
STATISTICAL METHODS IN THE COSMETIC INDUSTRY From tables x'(2 d.f.)--7.82 at p--0,02. Therefore there is still a ificant difference between preference for A and B. The effect of the ation'of small grotrps has been to reduce the unbalanced contribution they m.a..• e to x• over half the value of x' for the first group of 64 :sults is contributed by. the group with expected frequency 4. ß : -•:, . '."it is not n'ec'6ssary to be able to' calculate the expected frequency in order use th½'X' test.,' An example will show this ' . • - . ,.. ".• .. , •! . , . , Deliveries of bottle caps are received from'two suppliers to fit a bottle, :obtained from one supplier, which is capped automatically after filling. A 3 gross of..c•ps is takeg on. re•ceipt from the supplier A .and bottles '19apped with them in the regular routine, note being kept of the faulty caps. 5 gloss are inspected from supplier/•. Results are: Faulty Satisfactory Total Suppl{er A ... ' 12 420 432 Supplier 2• ....... 30 690 720 Totals ":?.. 42 1,110 1,152 '•?i• there any significant difference between these fwo deliveries of Cal•S ? •i')i}:i•The Null Hypothesis is that there is no difference between them, and the •'"•!:•Probability thaf the resets obtained are due to chance has to be asce•ained. •: :Th expectation of fatty caps in the first cell is X , X 1,152= 15-7 •::•:• 1,152 1,152 •}? Similar calc•ations are made for the other cells, to give an expectation table ß Faulty Satisfactory Total Supplier .4 ...... 15.7 416.3 432 Supplier B ...... 26-3 693-7 720 Totals ... 42 1,110.0 1,152 I Accordingly, X• 3.7' 3.7 • 3-7 • 3'7' __ 1'71 :-- 15..7 q- 4•-• + 2•Z-• + 693.7 ,' .:' This x' value has only one 'degree of freedom, for given the marginal totals one can fill only one cell arbitrarily reference to the table of x' ß gives for x'• •4. -- 1-71, p is between 0.2 and 0'1.(X' for these values of p is 1.64 and 2-71 respectively). Thus there is no evidence of a significant difference between the caps from the two suppliers although expression of the faults as a per cent of those examined gives: 247
Purchased for the exclusive use of nofirst nolast (unknown)
From: SCC Media Library & Resource Center (library.scconline.org)