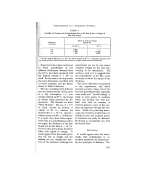
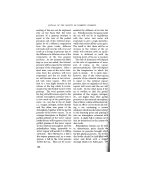
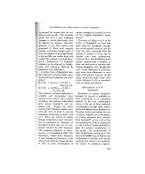
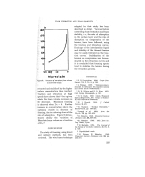
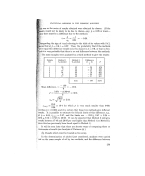
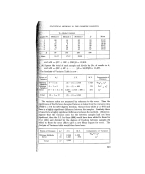
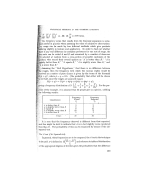
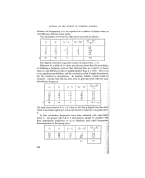
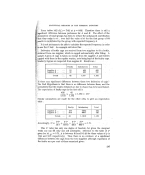
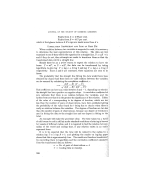
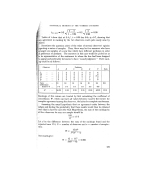
JOURNAL OF THE SOCIETY OF COSMETIC CHEMISTS Faults from A = 2.78 per cent. Faults from B -- 4.17 per cent. which at first glance looks as if B's caps are much worse than A's. CORRELATION COEFFICIENT AND LINE OF BEST FIT When a relation between two variables is suspected to exist, it is necessary to determine the best representation of this relation. The data are first examined to see if they will fit the equation for a straight line, Y -- aX q- b, and if they do not, then attempts are made to transform them so that the transformed data will fit a straight line. Should there be an a priori reason to expect the relation to have the forms Y--ab x, or Y--= aX b, the data can be transformed by taking logarithms to give log Y --- log a q- X log b and log Y -- log a q- b log X respectively. Since a and b are constants, the•e equations are seen to be linear. The probability that the straight line fitting the data would have been ? obtained by chance had there been no valid relation between the variables can be assessed by calculating the correlation coefficient, r. x(x - X (Y - P) ß: x/x(x - 5:) - This coefficient can have any value between 1 and -- 1, depending on whether .• the straight line has a positive or negative slope. A correlation coefficient of zero indicates that there is no relation between the variables, and farther from zero that it is the greater the significance of the relation. Tables }ii! of the value of r corresponding to its degrees of freedom, which are less than the number of pairs of obseryations, have been published giving '(• the probability of the value found for r being due to chance when there really no relation between the variables. The degrees of freedom are two than the number of pairs of observations, because one degree of freedom is ::?• used in fitting the data to the straight line and one degree in fitting to total. An example will make the procedure clear. The time taken by a of cold cream to cool in still air under standard conditions of stirring is knowg ?• for vessels of different radius, and it is required to find the relation between?j radius of the vessel and cooling time, if any relation exists in an easily?:i•i! expressed form. It is to be expected that the time will be related to the radius relation log T----• log R q- b, and plotting the results on log/log paper:i.: • shows that this is approximately true. The results are therefore transformed.i ! by converting them to logarithms and the correlation coefficient calculate..C?i'•' from the transformed data as follows ' n = No. of pairs of observations -- 4. T = Cooling time in minutes. 248

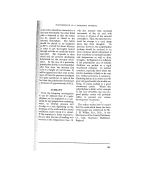
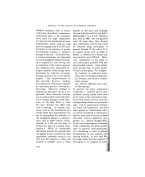
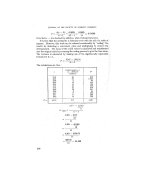
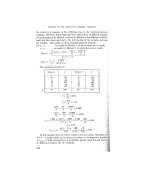
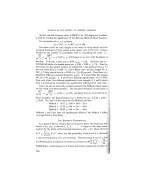
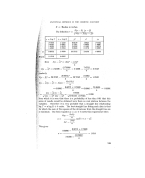
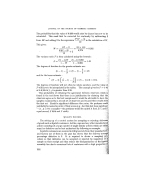
STATISTICAL METHODS IN THE COSMETIC INDUSTRY R -- Radius in inches. By definition r -- oe(x -- .•) (y --•) V' oe(x -- 7r)'(y -- y =LogT [ x=LogR y2 . _ x• xy 3-1004 1.2175 9.6128 1.4823 3-7732 2.4065 0-8261 5.7914 0.6824 1.9880 1-6020 0.3979 2.6262 0.1583 0.6374 1.4983 0.3284 2.2448 0-1078 0.4920 8-6072 2-7699 20-2752 2.4308 6.8906 2'1518 0'6925 Now z(x -- •)'= z½), -- (Zx), x -- })•-- 2.4308 (2'7699)• -- 2-4308 4 milarly •.•)• --- 20-2752 (8'6072)• -- 20'2752 4 z(,• . )(y - ) = z(xy) z(,O zly) 7.6722 --0.5127 4 74-083 -- 1.7042 4 8-6072 • 2-7699 23.8405 --• 6.8906 -- --- 6'8906 -- 0'9301 4 4 Z'(x -- •)(y --_,•) 0-9301 : 0-996 __.-. •/2:(x -- •)• oe(y --.•)• •/(0.5127) (1-7042) which it is seen that there is a probability of less than 0.01' that this of results would be obtained were there no real relation between the Therefore it is very probable that a straight line relationship T -- a log R q- b exists. The best straight line fitting such data is that •for which the sum of the squares of the deviations from the straight line are . ß a minimum. Our basic equationy --- ax + b meets this requirement when ..: ZxZy Zxy • a-- and'b = y -- a• ( Z'X • __ -- 6.8906 -- 8.6072 4- 2.7699 2.4308-- " (2-7699)' 4 = 1.814 249
Purchased for the exclusive use of nofirst nolast (unknown)
From: SCC Media Library & Resource Center (library.scconline.org)