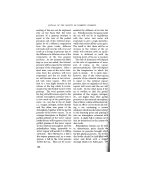
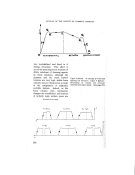
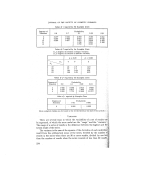
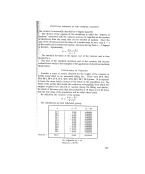
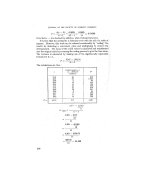
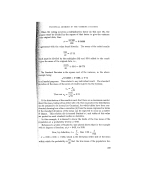
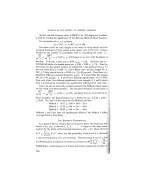
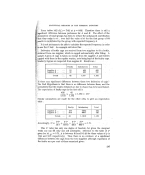
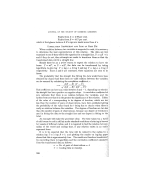
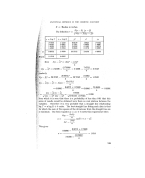
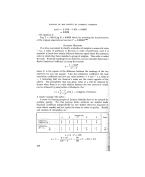
JOURNAL OF THE SOCIETY OF COSMETIC CHEMISTS The probability that the value of 0.268 would arise by chance has now to calculated. This must first be corrected for con. tinuity by s,ubtracting from 2 d' and adding 2 to the expression N•(n3 -- n) in the calculation of W. 12 This gives' . ß 117--2 12 X 115 W --- = -- 0.262 ' .: 5'(63 -- 6) 5,274 ]2 q- 2 The variance ratio F is then calculated using the formula ' F = (N- 1)W_ (5--1) 0.262_ 1.42 1 -- W 1 -- 0.262 The degrees of freedom for the greater estimate are ß 2 2 (n-- 1)----=(6--1)---=4.6 N 5 and for the lesser estimate' • (N--l)[(•--1)--•,/]=(5--1)4.6=18-4. - The degrees of freedom will not often be whole numbers,' and the value F will have to be interpolated in the tables. The example gives for F = 1.42 at 4-6/18.4 d.f., p is greater than 0.20. This probability of obtaining the agreem. ent between observers which found in the test shows that there is no justification for claiming that observers agree as to the best sample and it would be advisable to have the?i•i samples examined by a second set of observers and to pool their results with:!i? the first set. Should a significant difference 'then arise, the perfumes justifiably be ranked in order of their scores (e.g., had this test been significan{i• --i.e.,/5 -- 0-1 or smaller--the perfumes would be ranked 'A first, B, C and equal second, E fifth and F sixth). QUALITY CONTROL The setting up of a control system for'accepting or rejecting of goods such as lipstick containers, bottles, caps and any other article consisting of a large number of single similar articles which are sound or defective can be best understood by following an example. Lipstick containers are received in 100 gross lots from their and factory use of them in the past has shown that the delivery percentage defective is 2. It is required to d•vise a sampling cedure so that deliveries can be accepted or rejected by inspection of sample on their receipt and thus reduce the disorganisation on the assembly line due to occasional lots of containers with a high '252

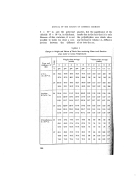
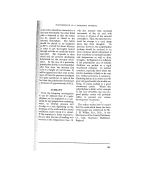
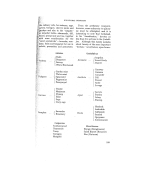
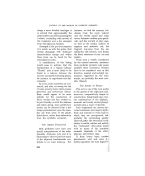
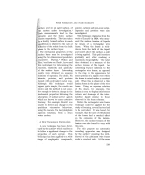
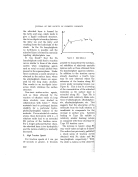
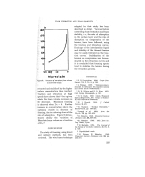
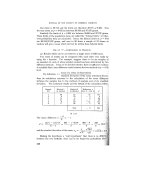
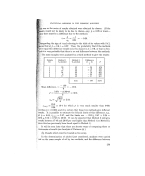
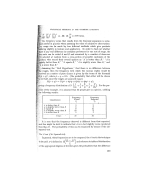
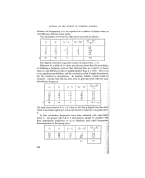
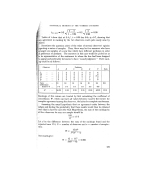
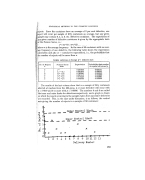
STATISTICAL METHODS IN THE COSMETIC INDUSTRY efts.' Since the containers have an average of 2 per cent defective, one ect will occur per sample of fifty containers on average, but any given may contain O, 1, 2, 3, etc. defective containers. The expectation of given number of defective containers is given by the appropriate term the Potsson Series, i.e.: e'"', me'm/l!, m•e'"'/2!, . ..... m is the average frequency. In the case.of 50 containers with an aver- frequency of one defective, the following table shows the expectation •icalculation and also (1 -- cumulative expectation), i.e., the probability that number of rejects will be more than n. $arnl•les containing an Average of I Defective Each No. of Rejects Potsson Series Expectation Probability that number n term of rejects will exceed n 0 e-• 0.367879 0.632121 1 1 e -• [1 ! 0.367879 0.264242 2 1 • e -¾2 ! O' 183940 0.080302 3 l a e -•[3 / 0-061313 0'018989 4 1 • e -•/4 / 0'015328 0.003661 5 1 • e -•/5 ! 0.003056 0.000595 ß The results of the last column show that in'a sample of fifty containers :::.½•iiSelected at random from the 100 gross, 4 or more defective will occur with = 0.019 and 6 or more with p • 0-0006. The numbers 4 and 6 are called '?ithe inner and outer limits for defectives respectively, and a graph is drawn which the rejects occurring in the samples taken from successive deliveries '•:•:are recorded. This, in the case under discussion, is as follows, the vertical •: i :'aXis giving the number of rejects in a sample of 50 containers' •m, mm m mm •m• Outer, CGntr_o_o 1 Limit Inner Control Limit Delivery NtLmb e r 253
Purchased for the exclusive use of nofirst nolast (unknown)
From: SCC Media Library & Resource Center (library.scconline.org)