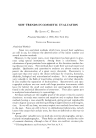
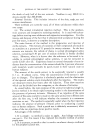
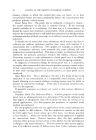
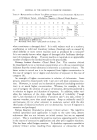
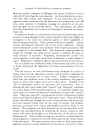
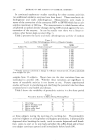
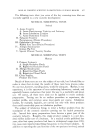
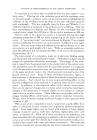
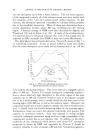
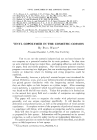
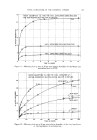
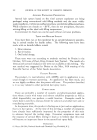
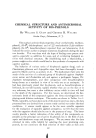
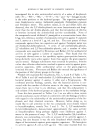
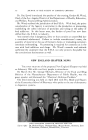
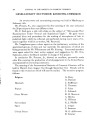
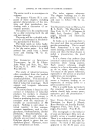
270 JOURNAL OF THE SOCIETY OF COSMETIC CHEMISTS 15'0 I10 I00 • 70 I.- :• 60 50 40, :50- 20, PAROTID CHOLINESTERASE PULSE DIASTOI_IC Figure 5 STRESS SYSTOLIC I00' .80- .60 ' .40 20 730 8•00 [ •OO IO O0 12 GO TIME Figure 6. m 0D ..... l0 •

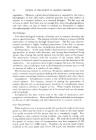
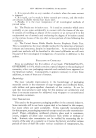
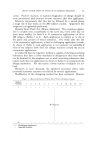
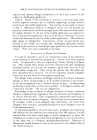
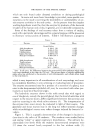
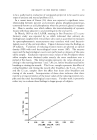
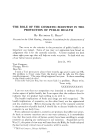
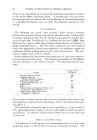
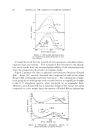
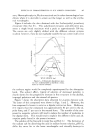
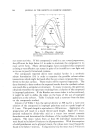
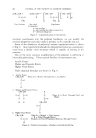
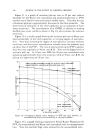
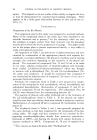
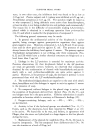
FHE BEAUTY OF THE ENZYME SCREEN 27I to be a useful tool in evaluation of compounds projected to be used in some types of anxiety and mental problems (15). In a recent issue of Cancer (16) there was reported a significant inter- relationship between parotid and prostatic gland, phosphomonoesterase, commonly known as acid phosphatase when the prostatic gland is neoplas- tic. Here is another case which reflects the interrelationship of systemic tissues with those adjacent to and secreting into the oral cavity. In March, 1959 at the I.A.D.R. meeting in San Francisco (17) a pre- liminary study was reported by us which indicated that salivary de- hydrogenases coupled with tetrazolium salts used as quantitative measures by spectrophotometric measurements may correlate with total bacterio- logical count of the oral microflora. Figure 6 demonstrates the findings on 29 subjects. Variations of reducing enzyme means are plotted as optical density (OD) with total bacteriological count means (10ø). The enzyme assay and the bacteriological counts were performed on aliquots of the same saliva sample. Each point represents mean values of the 29 subjects whose saliva samples were obtained under exactly the same conditions over a period of five hours. The initial sample represents the value obtained on arising in the morning between 7 and 7:30 a.m. before breakfast and before brushing or rinsing the mouth. The 8 a.m. sample represents the effect of eating breakfast and rinsing the mouth after breakfast, the 9 a.m., 10 a.m. and the 12 a.m. samples show the effect four hours after breakfast and rinsing of the mouth. interpretation of these data indicates that there may be a strong correlation of the mean values of the reducing enzyme com- plex and the total bacteriological count mean. Further work is presently under way to evaluate these findings in larger groups of subjects. .250- .200- .I 50- .o5o. .000 0 0.05 0.10 0.15 0.20 0.2•5 0.50 VOLUME SALIVA (ml) Figure 7.
Purchased for the exclusive use of nofirst nolast (unknown)
From: SCC Media Library & Resource Center (library.scconline.org)