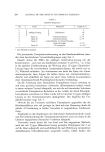
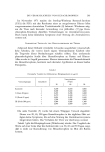
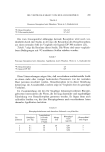
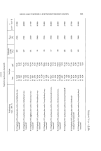
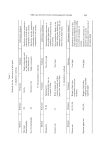
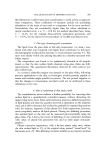
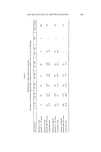
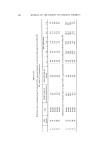
THE QUANTITATIVE DIFFERENTIATION 337 1. Examination of the method In order to investigate the quantitative relationship of transmission values and fat present on a slide, a 3 x 9 cm area of forehead skin was defatted with ethanol. Between 5-25 mg. of vaseline were applied and then removed onto glass slides to be weighed on a micro-balance. The alterations in trans- missions, a well as weight increases, were obtained in 10 cases and are shown in Table 2. A definite constant rate between amount applied and then removed Table 2 Comparison of gravimetric and photometric estimations /•g vaseline/cm • skin Increase in weight of glass slide in #g/cm • % of applied vaseline removed 185 42.0 23.0 315 69.0 22.0 500 115.0 23.0 666 175.5 26.5 926 216.0 23.5 average 23.6 is evident. This depends on the ratio of vaseline adhesion to skin and glass, respectively. Approximately one quarter (22-26.4 %) of the quantity applied adheres to the glass surface in agreement with relative forces of adhesion. Kadh (glass) : 0.30 radh (horny layer) Table 2 compares the photometric and gravimetric estimations. Since applied vaseline cannot be considered directly comparable with skin lipids, this table is not useful for calibration purposes. On the other hand a way of following the fate of fats or similar substances applied to the skin is indicated (see below). 2. Calibration A representative calibration curve, however, can be obtained, which does not involve the inaccuracies incurred by application of lipids to the skin. A constant ratio between lipids present and those removed during the applica- tion of pressure to the glass slide at the skin surface would permit such a calibration curve. If this ratio pertains, than consecutive impressions on the same skin segment would remove the same percentage of lipid present at

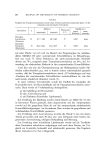
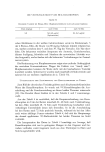
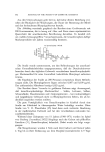
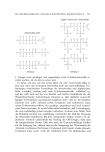
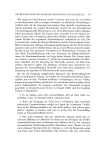
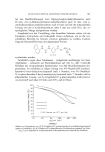
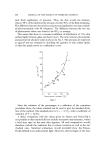
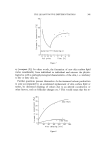
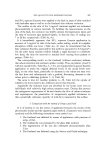
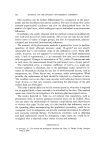
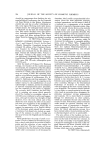
338 JOURNAL OF THE SOCIETY OF COSMETIC CHEMISTS each fresh application of pressure. Thus, the first would, for instance, remove 50 % of the lipid and the second, a further 50 % of the lipid remaining. The difference between first and second pressure application was than estimat- ed photometrically with 48 volunteers. The difference between the two sets of photometric values was found to be 50 % on average. This means that there is a constant coefficient of distribution of 1 for skin surface lipids between glass and horny layer. The ratio between photometric and gravimetric absolute values is shown in .Fig. 5. The amounts are expressed as/•g/cm •' and are obtained by doubling the quantity of skin surface lipids, so that this graph serves as a calibration curve. 130 110 90 • 70 50 30 10 2'0 4'0 6'0 8•0 Transmission increase [%] Figure 5 Since the variation of the percentages is a reflection of the estimation procedure alone, the values obtained can be used to give the standard devia- tion of the method. The standard error is S = 5 6.5 %, with a coefficient of variation of V = 12.8 %. A direct comparison with the values given by Strauss and Pochi (10) is not possible as their method did not include successive measurements, within a brief time span on the same skin segment. All such comparisons would, therefore, include the variations due to sebum excretion as well as the me- thodical ones. Statistical evaluations would inevitably show the Strauss- Pochi method in an unfavourable light. However, their averages of the stan-
Purchased for the exclusive use of nofirst nolast (unknown)
From: SCC Media Library & Resource Center (library.scconline.org)