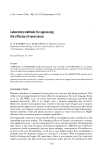
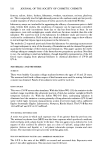
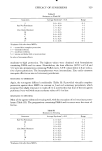
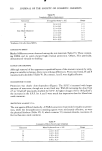
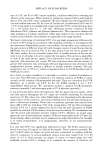
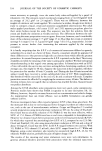
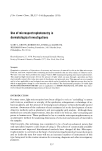
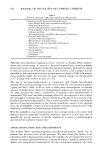
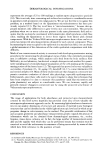
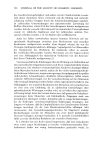
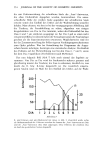
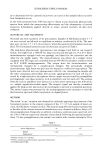
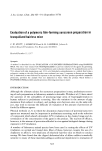
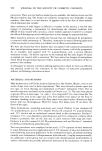
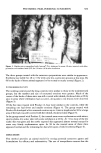
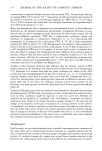
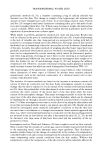
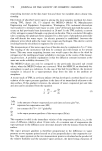
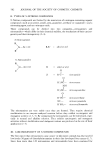
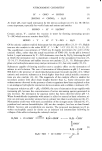
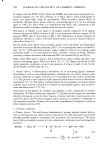
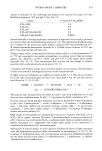
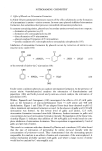
538 JOURNAL OF THE SOCIETY OF COSMETIC CHEMISTS 24020 . Figure 1. The Vickers M-85 scanning-integrating microspectrophotometer, courtesy of Mr. Robert Os- good, Vickers Instruments, Inc., Woburn, Massachusetts With this in mind, we would like to describe the fundamental principles ofmicrospec- trophotometry and illustrate how a variety of parameters, which are useful in assessing the pathophysiological status of human skin, can thus be easily and rapidly measured. Special emphasis will be given to the Vickers M-85 scanning-integrating microspec- trophotometer (Figure 1) that we routinely employ for our studies. INSTRUMENTAL DESIGN The principles of microspectrophotometry are similar to those of conventional spec- trophotometry (Figure 2). Both instruments are comprised of three main units, viz., 1)

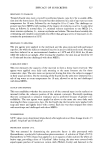
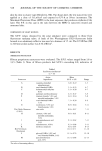
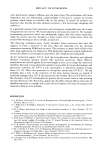
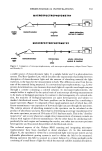
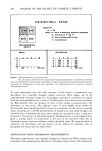
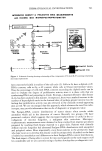
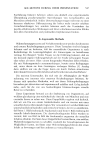
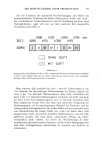
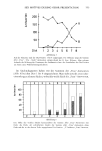
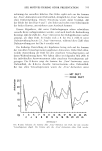
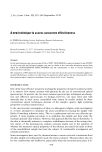
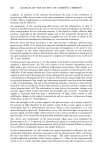
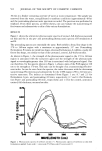
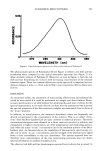
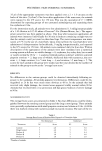
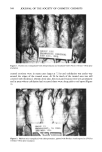
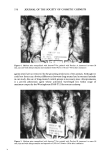
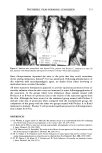
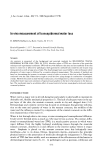
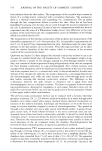
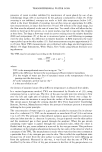
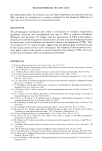
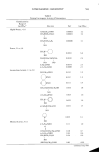
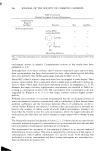
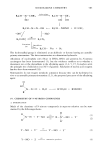
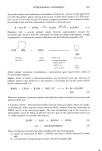
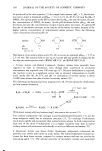
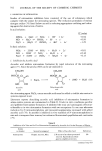
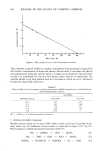
DERMATOLOGICAL INVESTIGATIONS 539 MACROSPECTROPHOTOM ETRY liable monochromator cuvette light • Iolutlon photo detection lyltem & readout MICROSPECTROPHOTOMETRY • o o liable monochromator microscope photo detection light • Syllem & readout illde Figure 2. Comparison of microspectrophotometry with macrospectrophotometry, adapted from Chayen and Bitensky (3) a stable source of monochromatic light, 2) a sample holder and 3) a photodetection system. The Beer-Lambert Law, which describes the exponential relationship between absorption of monochromatic light and the amount of absorbing material the light traverses, is the basis for the measurement in both. The differences arise from the na- ture of the material being measured. In conventional spectrophotometry, e.g., Lowry protein determinations, one measures how much light of a specific wavelength can pass through a cuvette containing a colored solution. In microspectrophotometry, the sample holder is replaced by the optical train of a microscope allowing measurements to be made on biological specimens. In contrast to the homogeneity of a colored solu- tion, the majority of biological specimens are quite heterogeneous and subject to marked distributional errors. This basic problem can be illustrated by considering a square specimen (Figure 3) composed of four equal segments each of which has a dif- ferent transmittance--an expression of how much light can pass through the specimen. The relative amount of absorbing material in the specimen can be calculated as the product of absorbance and area. Note that by determining an average transmittance for the entire specimen, an error of.054 units of 15% has been made. This is the "distribu- tional error" and occurs whenever a single direct measurement of intensity is made on objects with regions of diverse transmittance. On the other hand, by calculating inde- pendently for each region and summing the results, one takes into account specimen heterogeneity and thus avoids the problem of distributional errors. The technical aspects of the Vickers M-85 scanning and integrating microspec- trophotometer have been described in detail elsewhere (2). In this instrument (Figure 4), the specimen is viewed by a conventional light microscope system and an adjustable photoelectric grating system is used to define the field to be measured. During operation this field is scanned in a raster fashion by a flying spotlight probe consisting of a small beam of light for which the material exhibits maximal absorption.
Purchased for the exclusive use of nofirst nolast (unknown)
From: SCC Media Library & Resource Center (library.scconline.org)