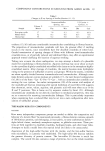
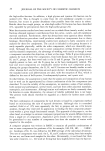
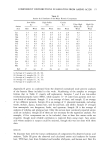
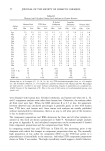
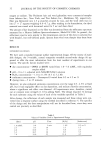
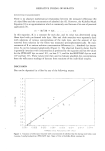
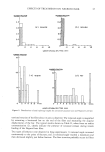
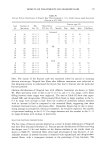
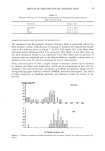
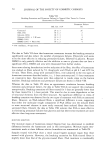
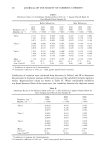
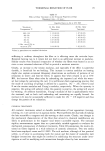
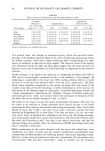
COMPONENT DISTRIBUTIONS IN KERATINS FROM AMINO ACIDS 21 Table II Amino Acid Analyses of the Major Keratin Components Low Sulfur High Sulfur Cuticle (L) (H) (C) Ultra High High Gly- Amino Sulfur (X) Tyr (G) Acid Hair Wool Hair Wool Hair Wool Wool Wool Lys 3.5 3.8 0.6 0.6 3.5 2.8 0.8 0.4 His 0.7 0.6 0.9 0.7 0.5 0.8 1.2 1.1 Arg 7.2 7.5 5.4 6.4 2.8 4.6 7.3 5.4 Hcy 7.7 6.0 27.2 19.2 19.6 16.3 29.5 6.0 Asp 9.4 8.9 2.5 3.2 3.2 3.4 0.7 3.3 Thr 5.4 4.8 10.3 10.2 4.3 4.5 10.9 3.3 Ser 9.0 8.7 11.9 12.8 15.0 14.1 12.9 11.8 Glu 16.7 15.6 8.4 7.4 9.3 8.7 8.2 0.6 Pro 3.8 3.8 12.7 12.9 9.8 11.0 13.5 5.3 Gly 5.1 7.1 6.1 6.5 9.4 8.6 4.6 27.6 Ala 7.0 7.0 2.3 2.9 5.6 5.7 2.0 1.5 Val 6.2 6.0 5.2 5.9 7.5 7.1 2.8 2.1 Ile 3.6 3.7 1.8 2.9 2.1 2.4 1.8 0.2 Leu 10.3 10.3 2.9 4.1 4.5 5.8 1.5 5.5 Tyr 2.5 3.5 0.7 2.3 1.7 2.7 1.8 15.0 Phe 1.9 2.6 1.1 2.0 1.2 1.5 0.5 10.3 Ref: 27 (a) 27 (b) (c) (d) (e) 26 (a) Average of 3 samples (26, 28, 30). (b) Average of 3 samples (26, 3l, 32). (c) Average of 3 samples (33, 34, 35). (d) Average of 3 samples (31, 36, 37). (e) Average of 2 samples (24, 32). Appendix II gives in condensed form the observed normalized mole percent analyses of the keratin fibers included in this work. Numbering of the samples or averages follows that in Table V, mostly self explanatory. Samples 7 and 8 are low-sulfur trichothiodystrophic hairs (TTD), while samples 11-15 come from patients with var- ious kinds of ichthyosis. Sample 11 is an average of three, and sample 12 an average of two different patients. Sample 26 is an average of 11 placental mammals, including wools, mohair, alpaca, human hair, seal fur and hair, and rabbit. Sample 27 averages four marsupials: two kangaroos, koala, and opossum. Sample 28 is the average of analyses of echidna and platypus hair. Only the sixteen most commonly reported amino acids are included, though all of these are not necessary for the regression analysis. For example, if five components are to be included, then at least five amino acids are required, though more reliable correlation is expected from using more. Any amino acid whose analysis is suspect could be omitted, though this was not done with these data. RESULTS To illustrate how well the linear combination of components fits observed amino acid analyses, Table III gives the observed and calculated amino acid analyses for human hair, TTD hair, hair from X-linked and lameliar ichthyosis, and human nail. Best fits

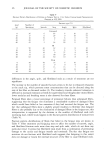
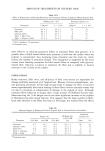
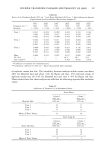
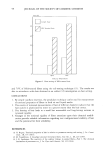
22 JOURNAL OF THE SOCIETY OF COSMETIC CHEMISTS Table III Observed and Calculated Amino Acid Analyses for Human Keratins X-linked Lameliar Human Hair TTD Hair Ichthyosis Ichthyosis Amino Acid Obs Calc Obs Calc Obs Calc Obs Calc Obs Calc Human Nail Lys 2.5 2.5 3.9 3.6 2.2 3.3 2.7 2.6 3.1 2.8 His .8 .8 1.0 .6 .5 .6 .6 .7 1.0 .8 Arg 6.2 6.1 6.2 7.2 4.2 5.5 5.9 7.0 6.5 6.7 Hcy 16.7 17.2 7.1 7.6 10.1 12.2 11.8 12.2 10.7 11.2 Asp 5.3 5.4 8.6 8.1 6.3 6.7 6.1 6.3 7.1 7.2 Thr 7.2 7.0 5.4 5.0 6. l 4.9 7.9 6.9 6.1 5.8 Ser 11.8 11.4 9.5 9.4 15.0 11.4 11.6 10.5 11.4 10.3 Glu 12.1 12.1 14.6 14.6 18.1 13.1 14.1 12.3 13.7 13.3 Pro 8.6 8.2 5.6 4.9 8.4 6.2 7.9 7.6 5.9 5.6 Gly 6.2 6.3 6.6 7.2 10.0 7.8 7.4 6.8 8.0 7.8 Ala 4.6 4.9 7.1 6.7 6.4 6.2 5.3 5.3 5.5 5.7 Val 5.8 5.6 6.6 6.1 1.8 6.5 5.7 5.8 4.2 5.5 lie 2.6 2.6 3.6 3.5 3.1 2.9 3.0 3.3 2.7 2.9 Leu 6. l 6.3 9.4 9.6 5.0 7.8 6.8 7.6 8.4 8.2 Tyr 1.9 2.1 2.5 3.4 1.5 2.8 1.3 3.0 3.2 3.7 Phe 1.6 1.5 2.2 2.5 1.4 2.1 1.8 2.2 2.5 2.5 % L 44 86 (57) (57) 69 % H + X 35 4 (0) (38) 12 % C 19 10 (38) (5) 8 % G 2 0 (5) (0) 11 RMS dev: 0.23 0.50 2.35 0.84 0.49 Human hair av. of 6 samples (27, 35, 38, 39, 40, 41) TTD (trichothiodystrophic hair), av. of 2 samples (27, 28) X-linked ichthyosis, av. of 3 samples (41) Lameliar ichthyosis (42) Human nail (40). Percentages are mole percent, rounded to one place without normalizing. Figures in parentheses are considered un- reliable because of the magnitude of R. Hcy ig the sum of half-cystine or S-carboxymethylcysteine, plus cysteic acid. were obtained with human hair, X-linked ichthyosis, and human nail when the L, H, and C component analyses were taken from human hair. Otherwise, the analyses taken all from wool were best. When the RMS deviation R is 0.5 or less, the agreement between observed and calculated percentages is generally good, as seen with human hair, TTD hair, and human nail. Since amino acid analyses are usually published without reproducibility information, there is no way to tell what part of the deviation is due to analytical error. The component proportions and RMS deviations for these and all other samples ex- amined in this work are shown summarized in Table V. Normalized sample analyses are given in Appendix II, and calculated compositions can be reconstructed if desired from component proportions and the compositions from Table I. In comparing normal hair and TTD hair in Table III, the interesting point is the sharpness with which the changes in component proportions show up. The unusually high proportion of low sulfur (L) component (86%) in the TTD hair points to a preponderance of micro fibrils in the structure. Individual TTD component proportions shown in Table V are similar. This high crystallinity would suggest a brittle behavior,
Purchased for the exclusive use of nofirst nolast (unknown)
From: SCC Media Library & Resource Center (library.scconline.org)