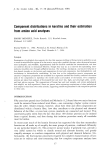
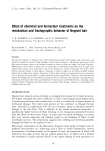
j. Soc. Cosmet. Chem., 36, 31-37 (January/February 1985) Oxidative dyeing of keratin fibers KEITH C. BROWN, STANLEY POHL, ANNE E. KEZER, and DAVID COHEN, C/alto/Research & Development Laboratories, 2 B/ach/ey Road, Stamford, CT 06922. Received October 31, 1984. Presented at the Annual Meeting of the Society of Cosmetic Chemists, New York, December 6-7, 1984. Synopsis Dye uptake by hair and wool cloth has been measured by a reflectance technique. Using a statistical experimental design, color formation from a single pair of reactants has been used to define and quantify many of the factors that control the process. Although peroxide concentration has little effect, color intensity depends on the concentration of reactants and added surfactants and on the dyeing time. These results can, in some cases, be predicted from the solution kinetics of the coupling reaction where the rate- controlling step is formation of a reactive intermediate from hydrogen peroxide, followed by a series of faster oxidative and coupling steps to give the dye. However, there are significant differences between the dyeouts and solution chemistry reflecting the important role of the substrate on the dyeing process. INTRODUCTION Previous studies on the chemistry of oxidative dyeing of keratin fibers have concentrated largely on the reactions occurring in dye solutions (1-3). While these results appear to correlate with actual fiber dyeouts in most cases, there are significant differences reflecting both chemical and physical effects of the substrate. In addition, the oxidant used for the solution studies, potassium hexacyanoferrate, is not commonly used in dyeing practice. We now report results on dye uptake by hair and wool and on the factors that control the process when hydrogen peroxide is used as oxidant. In particular we have evaluated the amount of color deposited on hair and wool from two oxidative dye couples in use in current hair dye formulations: p-phenylenediamine (PPD)/4- amino-2-hydroxytoluene (AHT) and N, N-bis-(2-hydroxyethyl)-p-phenylenediamine (BHP)/1-naphthol (NAP). This paper describes the variation of dye uptake with factors such as dye and H202 concentration, solution pH, dyeing time and concentrations of ammonia and surfactant in the dye solution and compares the results with those predicted from the kinetics and mechanism of the solution reaction. EXPERIMENTAL All dyeing solution components were commercial materials used without further pu- riffcation. Samples of indo dyes were isolated from coupling reactions using atmospheric 31

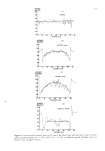
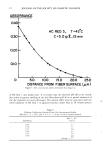
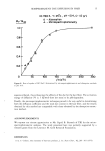
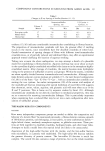
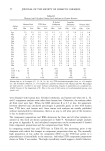
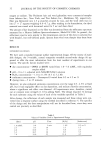
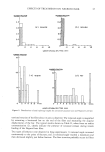
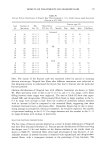
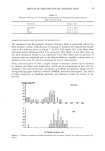
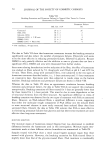
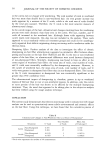
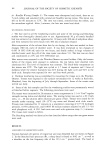
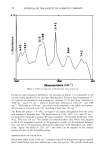
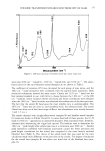
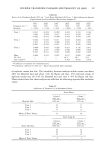
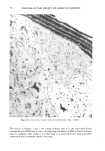
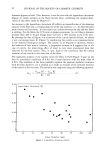
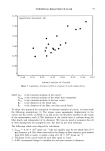
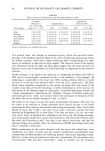
32 JOURNAL OF THE SOCIETY OF COSMETIC CHEMISTS oxygen as oxidant. The Piedmont hair and wool gabardine were commercial samples from Arkinco Inc., New York, and Test Fabrics Inc., Middlesex, NJ, respectively. Hair was fabricated into 2.5 g swatches secured by wax, and the wool cloth was cut into 2" X 2" squares weighing 0.6-0.7 g. After soaking in the formulation, the dyed material was rinsed with deionized water for 5 sec and then dried. The amount of dye deposited on the fiber was determined from the reflectance spectrum measured by a Hunter LabScan Spectrocolorimeter, Model LS-5100. In general, the reflectance spectra were similar to the transmission spectra of the dyes in solution but with broader, less well-defined peaks. Spectra from wool were sharper than those from hair. RESULTS EXPERIMENTAL DESIGN We have used a standard response surface experimental design. Of the variety of avail- able designs, the 5-variable, central composite rotatable second-order design (4) ap- peared to offer the most information from the least number of experiments in our system. The specific factors studied were: © dye concentration--[PPD] or [BHP] varied from 1.0-7.0 mM/L, with equimolar coupler added © pH--9 to 11, adjusted with NH4OH/NH4C1 solution ß H20 2 concentration--1.0 to 11.0% (0.3 to 3.2 M) © surfactant concentration--Nonoxynol-9 varied from 0.5 to 4.5 wt % © dyeing time--5 to 25 minutes However, we also evaluated ammonia concentration over the range 0.5-4.5% at fixed pH, but it had negligible effect on dye deposition, and sodium chloride concentration, where a significant salt effect was observed. All experiments were, therefore, carried out at constant ionic strength (1.1) by adding NaC1. The design required 32 dyeings for each substrate using the values of each of the variables specified in Table I. After dyeing, the reflectance of each sample was measured and these values were con- verted into a response surface using the method described in reference 4. The specifics of the design and the data manipulation will not be described here, since they were carried out precisely as described. Table I Values of Variables Used in Experimental Design [Dye] pH Time [8202] [Surfactants] 1.0 mM/L 9.0 5 min. 1.0% 0.5 wt % 2.5 9.5 10 3.5 1.5 4.0 10.0 15 6.0 2.5 5.5 10.5 20 8.5 3.5 7.0 11.0 25 11.0 4.5
Purchased for the exclusive use of nofirst nolast (unknown)
From: SCC Media Library & Resource Center (library.scconline.org)