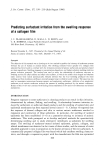
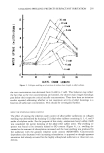
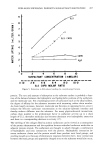
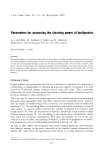
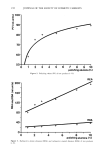
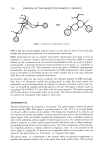
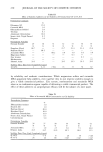
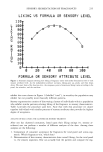
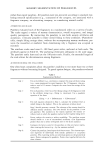
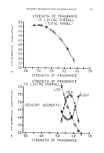
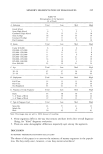
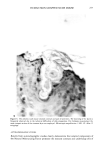
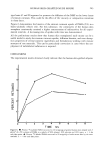
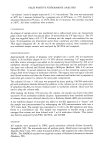
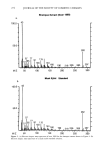
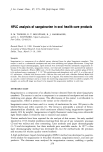
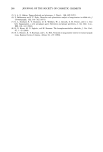
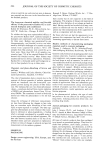
SENSORY SEGMENTATION OF FRAGRANCES 235 LIKING US FORMULA OR SENSORY LEVEL 118 L 188 K I 88 N 78 G G8 R 58 A 48 T I •8 N •8 G 18 8 0 20 40 60 80 100 FORMULA OR SENSORY ATTRIBUTE LEVEL Figure 1. Schematic diagram showing how liking of fragrance varies with either formulation level or with sensory attribute level. As the independent attribute increases, liking goes up, peaks, and then drops down. The exact form of the function (viz., the steepness, point of maximum liking) varies according to the panel, the stimulus, and the attribute. exhibit the curve shown in Figure 1 (labelled "total"), in actuality the population may exhibit two (or possibly more) basically different patterns. Sensory segmentation consists of discovering clusters of individuals within a population who exhibit similar patterns relating liking of the fragrance to sensory characteristics. Table I provides the procedure used here. Note that with this procedure we cluster together individuals with similar patterns of sensory attributes that provoke the highest degree of acceptance. ANALYSIS OF DATA USING THE CLUSTERS OR SENSORY SEGMENTS After one has clustered consumers, based upon their liking ratings (vs. sensory at- tributes) one can perform a number of different analyses of the data. Among these analyses are the following: 1. Comparison of consumer acceptance for fragrances for total panel and across seg- ments. Which fragrances win, which lose? 2. Determination of how sensory characteristics drive overall liking, for the total panel vs. the sensory segments. One can actually find the pattern and compare the seg-

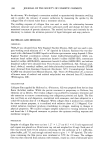
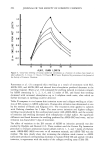
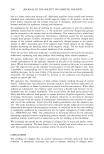
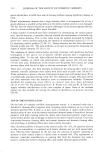
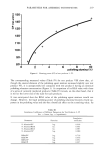
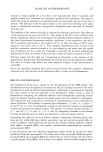
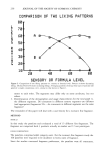
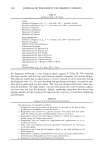
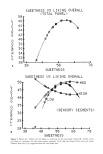
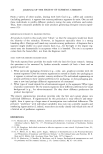
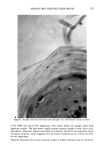
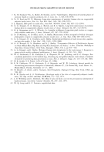
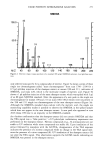
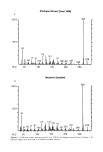
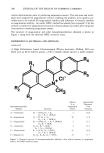
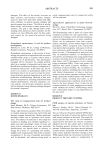
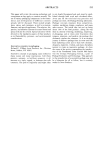
236 JOURNAL OF THE SOCIETY OF COSMETIC CHEMISTS COMPAR I SON OF TWO LI KING PATTERNS L I K I N G 88 78 58 R 40 A T I 30 N G 20 18 A B 20 48 GO 80 SENSORY OR FORMULA LEVEL Figure 2. Comparison of two liking patterns (vs. sensory or formula level). Pattern A shows decreasing liking, whereas Pattern B shows increasing liking. Averaging panelists showing these types of patterns will generate a single compromise curve, similar to that shown in Figure 1. ments to each other. The segments may differ only on some attributes, but not others. 3. Determination of the demographics and usage characteristics for the total panel vs. the different segments. Do consumers in different sensory segments use different (and appropriate) fragrances? Or--do consumers in different segments use the same fragrance? The remainder of this paper will deal with a case history for a wonnan's fine fragrance. METHOD STIMULI In this study the panelists each evaluated a total of 15 different fine fragrances. The fragrance set comprised both 3 products actually in market and 12 test prototypes. PANEL COMPOSITION The panelists comprised adult category users. For the woman's fine fragrance study the 160 panelists were required to be moderate to heavy users of fragrance. Since the studies concerned fragrance preferences, the panelists were all consumers,
Purchased for the exclusive use of nofirst nolast (unknown)
From: SCC Media Library & Resource Center (library.scconline.org)