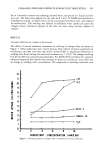
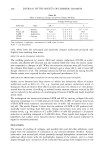
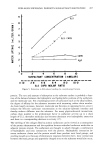
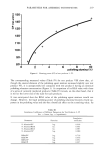
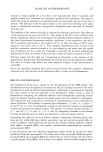
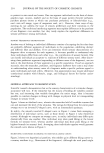
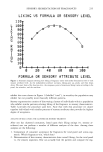
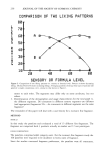
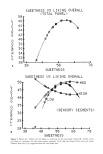
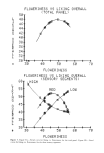
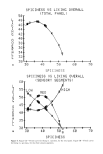
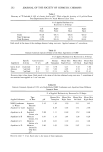
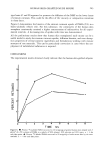
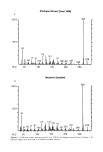
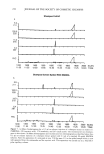
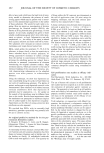
SENSORY SEGMENTATION OF FRAGRANCES 237 rather than expert panelists. All panelists were pre-recruited according to standard mar- keting research specifications (e.g., consumers of the category, not associated with a fragrance company, an advertising company, or a marketing research outfit). ATTRIBUTES AND SCALES Panelists evaluated each of the fragrances in a randomized order on a variety of scales. The scales tapped a variety of sensory characteristics, overall acceptance, and image/ quality perceptions. By instructing the panelists to rate both sensory attributes and acceptance, it became possible to relate overall liking to these attributes. (Parentheti- cally, simple liking ratings alone, without the accompanying sensory attributes, pre- vents the researcher or marketer from determining why a fragrance was accepted or rejected). The attribute scales used were 0-100 fixed point scales, anchored at both ends. The attributes appear in Table II. The anchoring eliminates ambiguity in the scale usage. The panelists easily learn and use the 100-point scale. Finally, the extended length of the scale allows for discrimination among fragrances. ACTiViTiES DURING THE EVALUATION One often hears complaints about the panelist's inability to test more than two or three fragrances without becoming fatigued. To guard against fatigue, the panelists evaluated Table I Segmentation Method Step •.' Step 2.' Step 3.' Step 4.' Step 5: Step 6.' For each attribute (e.g., sweetness), compute the mean attribute rating (e.g., mean sweetness) for every fragrance. For 12 fragrances, this gen- erates a total of 12 means. Compute the mean from the ratings of the total panel. For each panelist, relate his or her liking ratings of the fragrances tried to the attribute rating (e.g., liking vs. sweetness). Use a quadratic equation of the form: Liking = A + B(Sweemess) + C(Sweemess) 2. For each equation obtained in Step 2, calculate the attribute level at which liking is the highest. This is the optimum attribute level. Step 3 should generate a matrix. The columns of the matrix should be different sensory attributes. The rows should be the panelists (1 row per panelist). The numbers in the matrix represent the sensory at- tribute level at which the panelist reaches his/her highest liking level. Factor analyze the matrix to reduce variability. The attribute matrix should shrink to a set of uncorrelated attributes. (Use Eigenvalues greater than one to select orthogonal axes in the factor analysis.) Compute the factor scores for the panelists on this new factor matrix, after rotating the factors (e.g., by the varimax method). Cluster the panelists, based upon their factor scores. The clusters repre- sent segments of individuals with similar preference or acceptance patterns. The clustering works on individual points in the geometrical space. Points correspond to panelists. Points close together fall into the same clusters.

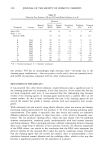
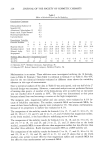
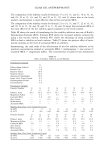
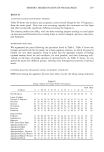
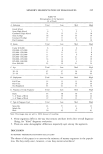
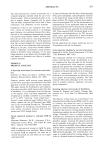
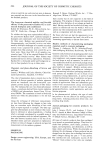
238 JOURNAL OF THE SOCIETY OF COSMETIC CHEMISTS Table II Attributes Used in the Study Sensory Strength of Fragrance (e.g., 0 = very weak, 100 = extremely strong) Sweetness of Fragrance (e.g., 0 = not sweet at all, 100 = extremely sweet) Spiciness of Fragrance Floweriness of Fragrance Heaviness of Fragrance Harshness of Fragrance Image/Appropriateness Freshness of Fragrance (e.g., 0 = not fresh at all, 100 = extremely fresh) Expensive Fragrance Different From Other Fragrances Sophisticated Fragrance Appropriateness for Daytime Use Appropriateness Appropriateness Appropriateness Appropriateness Appropriateness Appropriateness Overall Overall Liking, for Evening Use for Gift Giving for Special Occasions for a Young Woman for a Mature Woman for a Woman to Wear to Work (e.g., 0 = hate, 100 = love) the fragrances following a strict regimen which appears in Table III. The extended four-hour session, and the long waits between samples, eliminate true sensory fatigue. The olfactory system has an opportunity to recover virtually all of its sensitivity during the 8-minute wait (12). To avert boredom and psychological fatigue, we paid the pan- elists $35 to participate for the session. The coop fee increases motivation. Since pan- elists do not know "the right answer" (nor can they guess), the coop fee insures coopera- tion but does not bias the panelists. Indeed, marketing researchers have found that paying panelists actually increases the response rate or percent of consumers completing questionnaires. Table III Sequence of Activities During the Evaluation The session was choreographed as follows: 1. Respondents were pre-recruited one week prior to the study on the basis of their qualifying and availability to attend the session. 2. Respondents were oriented via a practice exercise. This insures that they under- stand the scaling procedure and adds quality control to the session. 3. Respondents received their first fragrance (blind) on a blotter and evaluated it on several sensory and image characteristics. 4. Respondents' data was checked for completeness and comprehension by an at- tending interviewer. 5. Steps 3 and 4 were repeated until each respondent evaluated all of the 15 products in the blind phase. 6. Respondents rated their favorite fragrance (Ideal) on the same attributes as the blind fragrances. 7. Respondents completed the classification and attitude and usage questionnaire to determine basic demographics as well as usage characteristics. 8. Respondents were paid for participation and dismissed.
Purchased for the exclusive use of nofirst nolast (unknown)
From: SCC Media Library & Resource Center (library.scconline.org)