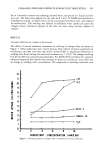
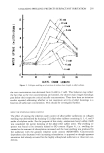
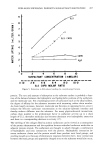
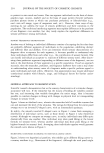
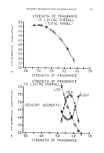
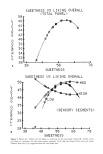
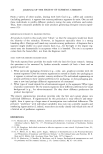
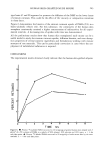
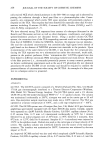
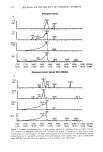
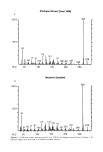
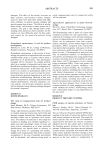
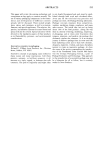
L I K I G 0 E R L L 58 48 4G 44 42 40 .• 4 F L rl •,] E R I N E S S U S L I K I N G (TOTAL PANEL) 0 U E R A L L •0 40 = • .-, ._,0 60 ,"C• F L 0 [,] E R I N E '.: S L I K I N G o u E R A L L 55 58 45 48 35 38 FLOWERINESS US LIKING OUERALL SENSORY SEGMENTS ) MED LOW • 30 40 50 60 70 F L 0 W E R I N E S S Figure 5. Figure 5A--Fitted curve for liking vs. fioweriness, for the total panel. Figure 5B--Fitted curves for liking vs. fioweriness, for the three sensory segments.

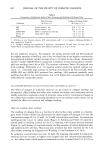
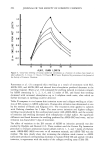
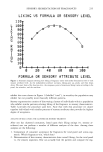
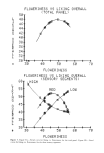
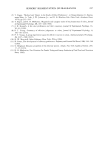
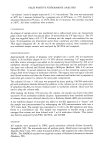
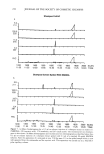
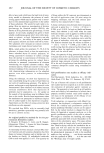
.50 b 4 "" i{ 46 H 44 G 4 :• L L .'3_,2 .30 ""P I f.: I HE':' S t.l.: L I K I Iq G (TOTRL PAIqEL) OUERALL Ii I ii 60 7 0 ß --, I ½: I H F.. o E R A L L 60 SF'I •:: I NESS ( S E N ':' I'1R "r' L I K I NG OUERALL SEGMENTS ) 55 OL4 I GH r,IED 50 45 40 •5 .'3_0 ,.0 . 30 40 50a 60 " ':'P I C: I N E""-' Figure 6. Figure 6A--Fitted curve for liking vs. spiciness, for the total panel. Figure 6B--Fitted curves for liking vs. spiciness, for the three sensory segments.
Purchased for the exclusive use of nofirst nolast (unknown)
From: SCC Media Library & Resource Center (library.scconline.org)