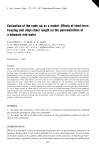
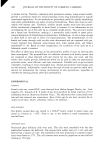
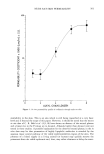
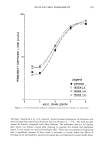
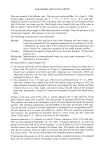
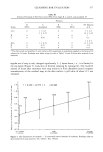
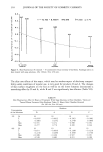
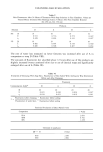
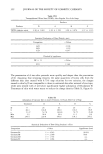
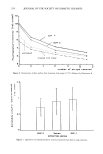
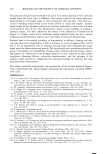
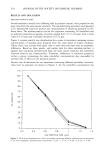
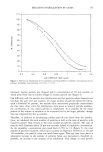
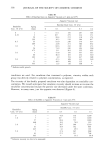
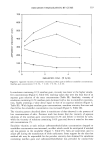
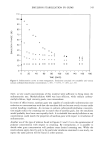
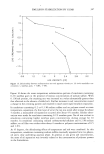
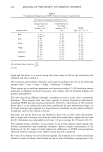
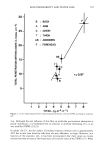
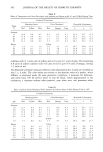
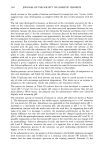
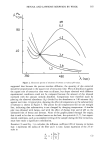
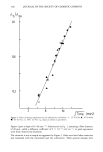
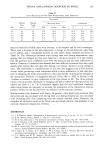
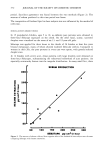
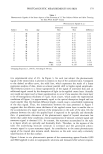
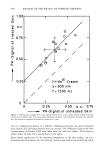
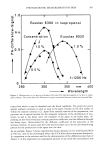
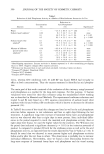
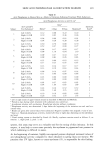
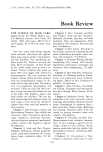
318 JOURNAL OF THE SOCIETY OF COSMETIC CHEMISTS o I o • •.1 L 0 Y - -I•. 455 * I•. 493/X B-O. 940 •.-'7. glõ d. 'F. -4 N-,43 0 0 N-21 Figure 4. Skin fluorescence (F (treated) - F (untreated)) versus intensity of erythema. Readings taken on skin treated with soap solutions. (Ex: 360nm / Em: 450 nm). The skin-care effects of the soaps, which may be another aspect of skin/soap compati- bility under conditions of regular use, is very good for products D and A. The changes of skin surface roughness on the face as well as on the lower forearms demonstrate a smoothing effect by D and A, while B and C are significantly less effective (Table VII). Table IV Skin Fluorescence After 24 Hours of Treatment With Soap Solutions in Finn Chambers. Values are Treated Minus Untreated Skin Readings Taken 24 Hours After Chamber Removal (Ex 360 nm, Em 450 nm) Products Concentration of the Solutions D A B C 2% 8% N 19 19 19 19 • -- 0.0797 - 0.0632 -- 0.1563 -- 0.1083 s x 0. 1863 0.2342 0.2748 0. 1896 Min -0.355 -0.274 -0.788 -0.392 Max 0.277 0.770 0.399 0.244 N 19 19 19 19 • - 0.673 - 0.0656 - O. 1398 - O. 1210 s x O. 2216 0.2690 O. 1849 O. 1766 Min - O. 398 - 0.406 -- O. 507 - O. 391 Max O. 519 0.682 0.221 O. 190

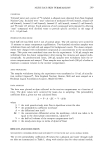
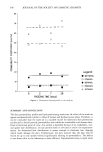
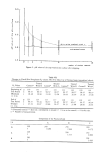
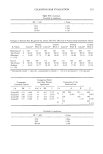
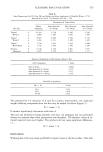
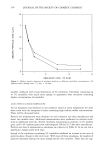
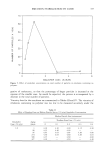
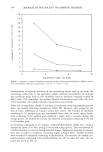
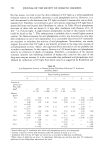
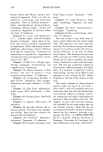
CLEANSING BAR EVALUATION 319 Table V Skin Fluorescence After 24 Hours of Treatment With Soap Solutions in Finn Chambers. Values are Treated Minus Untreated Skin Readings Taken 24 Hours After Finn Chamber Removal (Ex 290 rim, Em 350 rim) Products Solution D A B C 8% 2% N 19 19 19 19 • 0.572 0.716 0.572 0.422 Sx 0.428 0.403 0.341 0.427 N 19 19 19 19 • 0.482 0.594 0.519 0.360 Sx 0.486 0. 308 0.407 0.454 The rate of water loss measured on lower forearms was increased after use of A in comparison to soap D (Table VIII). The amounts of fluorescent dye adsorbed about 12 hours after use of the products are slightly increased (versus untreated skin) due to use of classical soaps and significantly enlarged after use of A (Table IX). Table VI Evaluation of Cleansing With Soap Bars. Fluorescence of Skin Soiled With Anthracene Was Determined Before and After Cleansing Treatment Contamination Index* D A B C N 20 20 20 20 • 0.021 0.030 0.024 0.027 Sx 0.014 0.021 0.019 0.011 Fluorescence after cleansing - fluorescence before soiling Fluorescence of soiled skin - fluorescence before soiling Statistical Evaluation of Data (Paired t-test) Comparison t Value D/A 2.681 D/B 0.792 D/C 1.478 Thresholds of signijS'cance: DF = 19 t Value 95% 2.093 99% 2.861
Purchased for the exclusive use of nofirst nolast (unknown)
From: SCC Media Library & Resource Center (library.scconline.org)