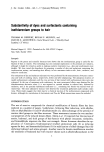
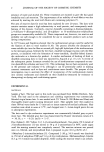
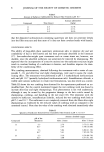
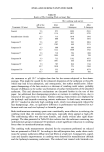
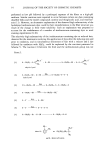
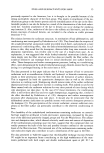
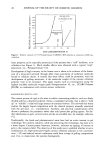
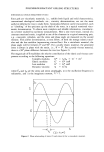
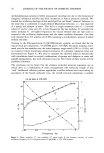
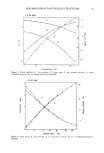
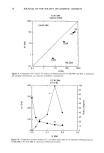
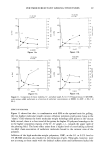
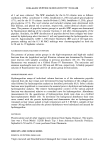
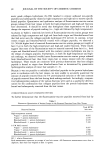
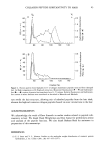
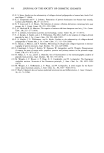
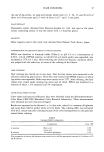
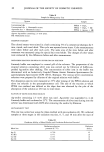
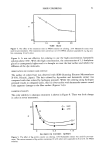
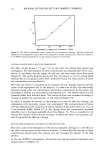
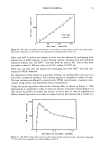
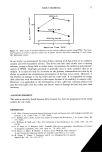
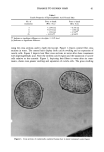
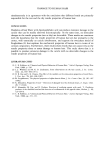
POLYMER/SURFACTANT GELLING STRUCTURES 25 1% JR 30M •5 10 50 5 , 2 Q- i 0.5 0.2 o.i 0.1 i ....... Frequency Hz Figure 5. Elastic modulus, G', loss modulus, G", phase angle, 8, and dynamic viscosity, qr I' versus oscillation frequency for 1% Polyquaternium-10 (JR30M). 1% JR 30M 4. 50 3 • 20 '• 2 0 o i0 5, i 5 '•i '2 '5 .... i0 •0 •0 ' ' ' Shear rate 1/s Figure 6. Shear stress, (y, and viscosity, qrl, as a function of shear rate for 1% Polyquaternium-10 (JR30M).

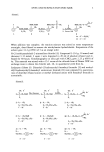
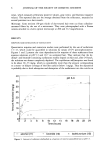
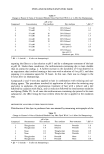
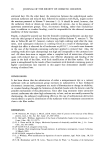
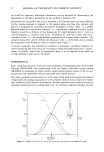
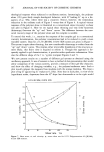
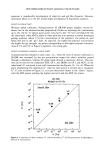
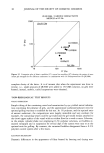
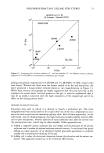
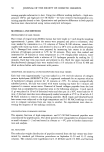
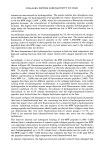
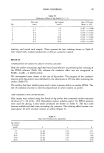
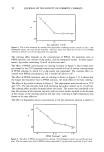
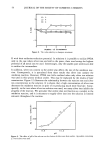
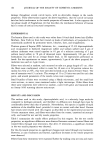
26 JOURNAL OF THE SOCIETY OF COSMETIC CHEMISTS rheological response when subjected to oscillatory motion. Interestingly, the polymer alone (1%) gave fairly simple rheological behavior, with G" leading G' up to a fre- quency of ca. 5Hz, where there was a crossover. Notice, however, the tremendous reduction in the ordinate scale of Figure 5 versus that of Figure 4. A typical viscous response of the polymer alone is illustrated in a conventional stress (viscosity) vs shear rate plot in Figure 6. Here we see typical shear thinning and very little hysteresis (thixotropy) between the "up" and "down" curves. The difference between the mea- sured viscosity range of the polymer alone and the complex is notable. To extend this work, i.e., examine the response of the complex gel in a conventional viscosity determination, the polymer concentration had to be reduced to yield a more tractable system. Data for a 0.2% JR30M, 0.02% SDS system are given in Figure 7. The system is again shear thinning, but now considerable thixotropy is evident from the "up" and "down" curves. This implies either irreversible breakdown of the structure or, more likely, that finite time is required to reform it. Though this approach is fre- quently applied in gel characterization, it provides rather qualitative information. Note also the different shape of the ß vs. •/plots (compare Figures 6 and 7). We now present results on a number of different gel systems as obtained using the oscillatory approach. It was of interest to have a method of data presentation that would allow comparison of the various systems, provide a measure of their gel-like character, and show the effect of changing variables, e.g., the polymer/surfactant ratio. Such a plot would compare the measured loss modulus with the storage modulus. We chose a plot of log G" against log G' (values at 0.2 Hz). Note that in such plots, in view of the logarithmic scales, departures from the 45 ø slope line downwards or to the right would 700, 600. 500 400 300 •00 •00 0.2% JR 30M, 0.02% SDS t0 5 'io •o 6o i6o 2oo Shear rate 1/s Figure 7. Shear stress, t•, and viscosity, x I, versus shear rate for 0.2% Polyquaternium-10 (JR30M), 0.02% SDS mixture.
Purchased for the exclusive use of nofirst nolast (unknown)
From: SCC Media Library & Resource Center (library.scconline.org)