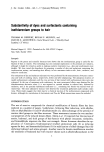
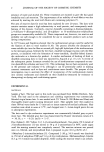
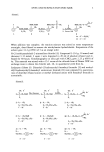
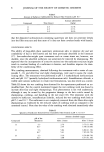
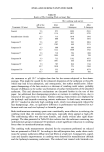
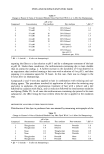
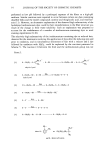
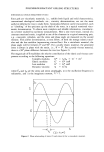
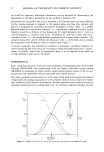
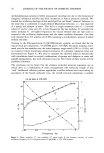
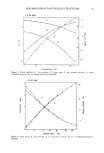
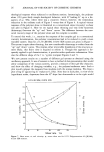
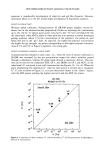
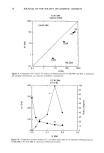
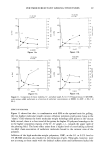
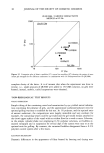
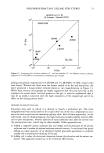
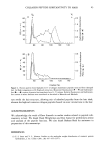
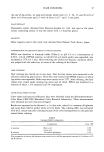
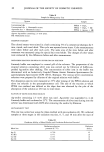
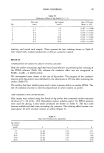
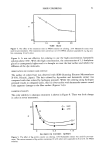
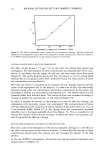
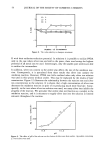
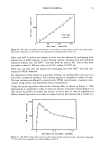
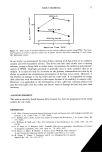
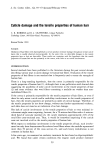
POLYMER/SURFACTANT GELLING STRUCTURES 27 represent a considerable development of elasticity and gel-like character likewise, movement above or to the left would imply development of liquid-like character. EFFECT OF SURFACTANT Without added surfactant, Polyquaternium-10 0R30M grade) displays viscous be- havior, but as the solutions became progressively thicker on increasing the concentration up to 2%, the G", G' datum point moves very close to the "45 ø line" (see Figure 8). On the other hand, when SDS is added to these solutions in an amount to realize maximum gelling tendency (about 1/10 the concentration of the polymer), the points lie well below this line in the "gel" field. As expected, the higher the polymer concentration the higher the gel strength: the points corresponding to the higher polymer concentra- tions of 1% and 2% in Figure 9 represent very strong gels. EFFECT OF DIFFERENT ANIONIC SURFACTANTS A general pattern emerged in most cases, viz., when the ratio of anionic surfactant to JR30M was increased (in the pre-precipitation range) the elastic modulus passed through a maximum, whereas the phase angle showed a monotonic decline. This pat- tern can be seen for the surfactants SDS, ES-3, and DDBS for ES-2 and AOT, on the other hand, G' continued to rise with concentration (see Figures 10, 1 la-d). When the point representing the maximum G' value for each system is entered into a composite G", G' plot as shown in Figure 12, it is seen that points cluster in the "elastic" region, with the SDS system yielding the highest elasticity and the AOT the lowest. Itt 30M Yodult at 0.2 Hz 10 • I i i I I I /'/1 • 10 -'• - O• 10 -'• 10 -• -/ G_el Ltk_e 10 -4 / • I I I I ! 10 -• 10 -2 10 -1 10 ø 101 10 2 10 • c' (Po) Figure 8. Comparison of elastic modulus, G', and loss modulus, G" for Polyquaternium-10 (JR30M) as a function of concentration.

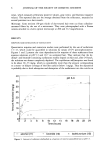
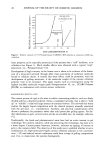
28 JOURNAL OF THE SOCIETY OF COSMETIC CHEMISTS % JR 30M Optimal [SDS] 1 ooo 1 oo lO 1 o.1 o.1 U_quid Like 0.2% (}.el Like , , 1 1 o 1 oo 1 ooo G'(Pa) Figure 9. Comparison of G' and G" for mixtures of Polyquatemium-10 (JR30M) and SDS, at maximum gel strength concentration, as a function of polymer concentration. 1% JR 30M at 0.2 Hz 400 100 300 200 lOO 90 0.1 0.2 80 70 60 • 50 ,•. -4-0 • - 30 - 20 -10 o o o.o 0.3 % SDS Figure 10. Comparison of elastic modulus, G', and phase angle delta, •, for mixtures of Polyquaternium- 10 0R30M) (1%) with SDS as a function of SDS concentration.
Purchased for the exclusive use of nofirst nolast (unknown)
From: SCC Media Library & Resource Center (library.scconline.org)