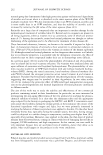
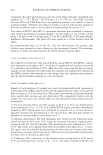
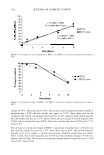
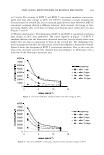
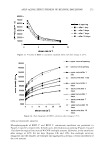
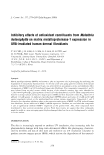
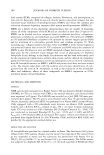
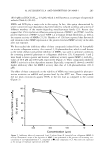
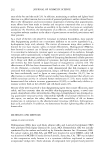
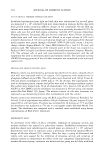
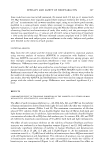
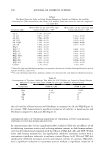
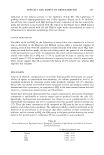
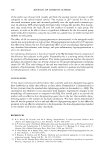
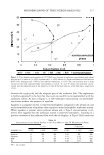
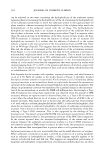
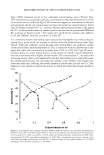
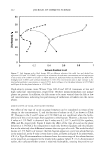
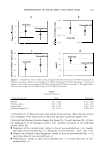
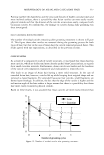
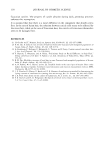
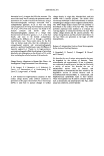
268 100 90 "'O 80 "'O 70 a, 60 "'O 50 40 C 30 e '#- 20 10 0 0 2 JOURNAL OF COSMETIC SCIENCE 4 y = 6,7266x + 2,8085 R2 = 0,9709 RETI C cone y = 5,9523x + 7,0805 R2 = 0,9613 RETI C 6 8 10 time (days) ♦RETI C ■RETI C cone Figure 3. Percentage of retinol degradation in RETI C and RETI C concentrate emulsions after storage at 40 ° C. 100 90 "C 80 C 70 · 60 a, 50 40 "ii 30 � � 0 20 10 a 0 2 4 6 time (days) 8 10 • RETI C • • • • ·RETI C cone Figure 4. Percentage of weight of RETI C and RETI C concentrate emulsions remaining after storage at 40 ° C. storage at 40 ° C. After one day at 40°C, the decrease in percentage of retinal in RETI C emulsion was 19.8% and the weight loss equal to 0.5%. After three days in the incubator, the retinal concentration decreased by 25.9% compared with initial amount, and the weight loss was at 2 .4 7 % . After a week, the percentage of retinol degraded was 49.8% and the weight loss was 40.8%, while after ten days they were 64.9% and 67.7%, respective! y. The decrease in retinal percentage in RETI C concentrate emulsion was 11.2% after one day, and the weight decreased by 3.5%. After three days at 40 ° C, the retinol showed a decrease of 27.9% in respect to initial concentration, while the weight loss was 14.6%. After a week, the retinal degraded was 42.8% and the emulsion weighed 29.1 % less. Finally, after ten days, the decrease in retinal percentage and the weight loss were 73.4% and 64.3%, respectively.

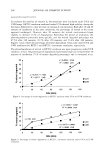
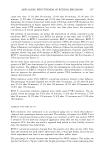
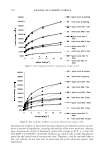
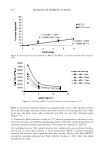
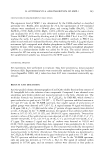
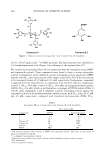
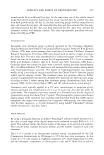
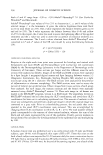
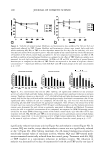
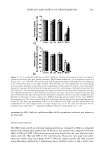
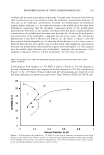
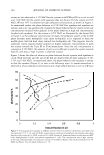
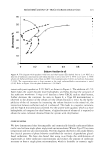
ANTI-AGING EFFECTIVENESS OF RETINOL EMULSIONS 269 (a) Viscosity. The viscosity of RETI C and RETI C concentrate emulsions was investi gated over time after storage at 40°C. For RETI C emulsion, viscosity progressively decreased until the seventh day, but it increased again after ten days. However, RETI C concentrate emulsion showed a different behavior, with viscosity decreasing at first, increasing slightly after seven days of storage, and showing lower values after ten days (Figures 5 and 6). ( b) Rheologic determinations. Flux rheograms of RETI C and RETI C concentrate emulsions after storage at 40 ° C were performed. The curves reported in Figure 7 of RETI C emulsion indicate that the shear stress decreased over time, but the found values were higher after ten days in comparison to those of the seventh day. The thixotropic hys teresis area appeared smaller, and the system, initially pseudoplastic, became Newtonian. Figure 8 shows the rheograms of RETI C concentrate emulsion. Also, in this case, the shear stress decreased and the flux changed from pseudoplastic to Newtonian with a reduction of the thixotropic hysteresis area. en §. - · 0 c., · en - 0 c., ·s: 80000 70000 60000 50000 40000 30000 20000 10000 0 0 :lK. .1.., ,:, -�-\.......... - --■ *. - . - - � � :_�:=--: :=: :_ � 5 10 • at opening - • - after 1 day - • - after 3 days - ·E- • after 7 days · - iK- - · after 10 days 15 Figure 5. Viscosity of RETI C emulsion before and after storage at 40 ° C. 80000 70000 60000 • at opening 50000 - • - after 1 day 40000 - • - after 3 days 30000 - ·E- • after 7 days 20000 • - • • · after 10 days 10000 0 a 5 10 15 Figure 6. Viscosity of RETI C concentrate emulsion before and after storage at 40 ° C.
Purchased for the exclusive use of nofirst nolast (unknown)
From: SCC Media Library & Resource Center (library.scconline.org)