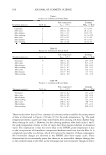
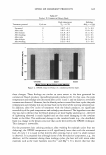
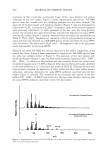
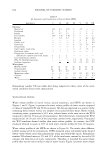
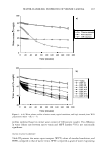
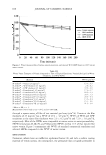
610 JOURNAL OF COSMETIC SCIENCE the in vivo skin barrier measurements, which show that glycerol is indeed the mildest to the skin barrier (see below). 11 The results of the in vitro ranking metric, RM! corresponding to the enhancement in the skin electrical current values relative to the in vitro control (iii), are reported in Table II. The skin electrical current values were converted to skin electrical resistivity values according to the procedure described in references 5 and 6. The mannitol skin perme ability values, P! and the skin electrical resistivity values, R! were then analyzed in the context of the theoretical model presented in the Theoretical section to obtain the average pore radius ( r pore and the pore number density (p), which are reported in Ta ble II. Recall that equation 1 indicates that if the RM value corresponding to an aqueous contacting solution is less than one, then that aqueous contacting solution induces a lower extent of skin barrier perturbation relative to the in vitro PBS control (iii). Conversely, if the RM value corresponding to an aqueous contacting solution is greater than one, then that aqueous contacting solution induces a larger extent of skin barrier perturbation relative to the in vitro PBS control (iii). An examination of Table II reveals that aqueous humectant-contacting solutions (iv and v) induce a lower extent of skin barrier perturbation because their RM values are both less than one, while aqueous surfactant contacting solutions i and ii induce a larger extent of skin barrier perturbation because their RM values are both greater than one. In addition, Table II reveals the following order of ranking for aqueous contacting solutions i-v (from the harshest to the mildest): (i) (1 wt% SDS) (ii) (1 wt% C 12 E6) (iii) (in vitro PBS control) (iv) (10 wt% PG) (v) (10 wt% G). It is important to note that the ranking of the permeability enhancement, P EIPc (see the third column in Table II), follows the order of ranking obtained using the in vitro ranking metric (RM), which corresponds to the skin electrical current enhancement, ! E lle (see the second column in Table II). This result indicates a strong correlation between skin electrical current and mannitol skin permeability measurements in vitro. 11 A Student t-test with a significance (p 0.05) indicates that each of the bars in Figure 2 is statistically different from the other bars. Table II Ranking Metric (RM) Values, Permeability Enhancements, Average Pore Radii, and Pore Number Density Enhancements Induced by Aqueous Solutions i-v Upon Contacting p-FTS In Vitro in Diffusion Cells Type of aqueous contacting solutions (i) 1 wt% SDS (ii) 1 wt% C 12 £6 (iii) PBS control (iv) 10 wt% PG (v) 10 wt% G Ranking metric RM (!Elle) 7.6 ± 1.0 3.5 ± 1.0 1.0 0.8 ± 0.2 0.6 ± 0.1 Permeability enhancement (pEIPc) 9.8 ± 2.0 4.7 ± 1.0 1.0 0.7 ± 0.2 0.3 ± 0.1 Average pore Pore number density radius, r p ore (A) enhancement (pEIPc) 33 ± 5 2.6 ± 1.0 38 ± 3 0.7 ± 0.5 20 ± 3 1.0 18 ± 2 0.9 ± 0.3 11 ± 4 1.7 ± 0.8 Note that the error bars represent the standard errors based on six p-FTS samples. In addition, note that E indicates enhancer (aqueous contacting solutions i, ii, iv, and v) and C indicates the in vitro PBS control (iii).

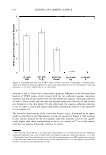
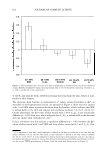
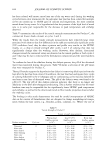
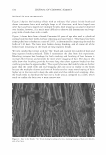
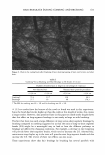
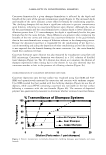
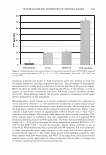
RANKING OF SURFACTANT-HUMECTANT SYSTEMS 611 Table II also reveals that 1 wt% C 12 E6 (aqueous contacting solution ii) induces the largest average pore radius, rpore! value when compared to aqueous contacting solutions i-v. Nevertheless, 1 wt% C 12 E6 ranks below 1 wt% SDS in terms of skin barrier perturbation, as reflected in both the RM and P EIPc values in Table II. This reflects the fact that 1 wt% SDS induces a much larger p E IPc value than that induced by 1 wt% C 12 E 6 , which more than offsets the larger r p ore value induced by 1 wt% C 12 E 6 . In addition, Table II reveals that the ranking metric (RM) value corresponding to 1 wt% C 12 E6 (aqueous contacting solution ii) is significantly larger than the RM values cor responding to the in vitro PBS control (iii) and to the aqueous humectant contacting solutions (iv and v). Transmission electron microscopy studies (21,24) have provided evidence that nonionic surfactants like C 12 E 6 can disorder, and at times, disrupt the ordered intercellular lipid bilayers in the SC. The disordering of the lipid bilayers of the SC can in turn result in a compromised skin barrier, and may also result in skin dryness (13-16,21-25). Another interesting observation from Table II is that 10 wt% PG (aqueous contacting solution iv) induces a smaller average p E IPc value, yet a larger average RM value, compared to 10 wt% G (aqueous contacting solution v). This result reflects the fact that 10 wt% PG induces a significantly larger rpore value relative to 10 wt% G, which more than offsets the smaller p E IPc value that it induces relative to 10 wt% G. There is evidence provided by the in vivo measurements reported below, as well as by other researchers (30,32,33), that G, because of its superior hygroscopic character, can better modulate water fluxes in the SC relative to PG, and therefore, can preserve the skin barrier more effectively than PG. It is important to note that the key measure of in vitro skin barrier perturbation is RM! which ranks aqueous contacting solutions i-v appropriately. The other model dependent variables, such as r 1 ,ore and pE/p0 provide additional useful information, thereby shedding light on the nature of the aqueous pores induced in the SC upon contacting p-FTS in vitro with aqueous contacting solutions i-v. RESULTS OF THE IN VIVO SKIN BARRIER MEASUREMENTS The deviation from baseline of transepidermal water loss (TEWL) values, determined using an evaporimeter as described in the Experimental section, are reported in Figure 3. In this figure, the height of each bar corresponds to the average TEWL value, which is measured as a deviation from the baseline, as explained in the Experimental section. Recall that TEWL is a measure of how easily water passes through the skin. Therefore, skin whose barrier has been compromised should exhibit a higher TEWL value (13,14). The bars in Figure 3 corresponding to the two aqueous surfactant contacting solutions (i and ii) are significantly higher than those corresponding to the untreated skin in vivo control (iii), and to the two aqueous humectant contacting solutions (iv and v) (Student t-test,p 0.05). These results indicate that aqueous surfactant contacting solutions i and ii induce a significantly larger extent of skin barrier perturbation, as determined by TEWL, relative to the in vivo control (iii), and to the two aqueous humectant contacting solutions (iv and v). In addition, a Student t-test conducted at a significance of p 0.05 indicates: (a) no significant difference between the deviation from baseline of TEWL values of skin treated with G or PG corresponding to the two humectant aqueous contacting solutions (iv or v), and (b) no significant difference between the deviation from baseline ofTEWL values of skin treated with the two surfactant aqueous contacting
Purchased for the exclusive use of nofirst nolast (unknown)
From: SCC Media Library & Resource Center (library.scconline.org)