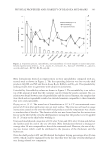
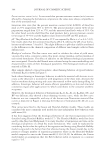
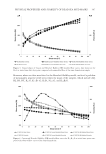
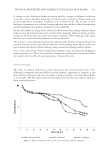
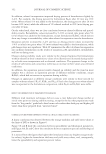
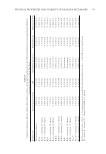
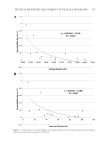
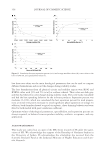
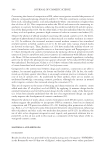
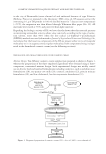
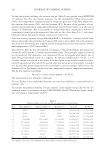
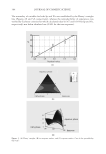
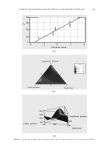
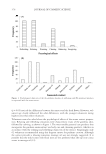
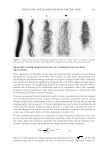
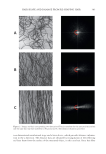
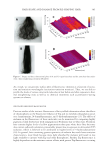
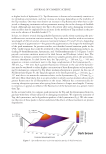
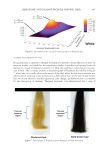
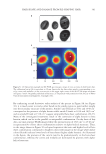
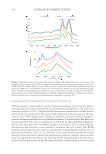
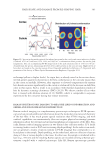
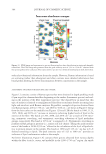
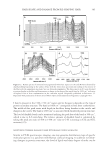
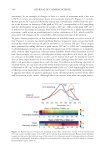
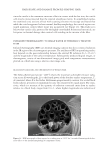
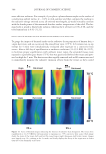
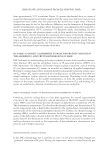
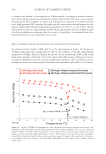
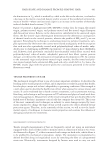
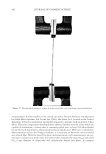
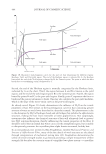
JOURNAL OF COSMETIC SCIENCE 394 molecular vibrational information about the sample. However, Raman information is based on scattering (rather than absorption) and often contains more detailed information (less broad peaks) allowing for better discrimination between constituents in the sample. ASSIGNMENT OF BANDS IN RAMAN SPECTRA OF HAIR Figure 12 contains a series of Raman spectra that were obtained in depth profi ling mode (2 μm steps) for a human hair fi ber beginning at the surface (lowermost spectra) and end- ing in the interior of the fi ber (uppermost spectra). One should bear in mind that this type of analysis is limited to nonpigmented hair fi bers as melanin absorbs incoming laser light and interferes with Raman emission. Regardless, examples of spectra obtained from two Raman regions, 400 to 1750 cm-1 and 2800 to 3020 cm-1, are shown in Figure 8. Going from the hair surface to the medulla (see Figures 12A and 12B) the bands at 1080, 1125, 1295, 2848, and 2878 cm-1 increase in intensity indicating higher levels of lipid in the interior of the fi ber. The bands at 1295, 2848, and 2878 cm-1 are a result of C–H twist- ing, symmetric stretching, and asymmetric stretching vibrations of lipid methylene groups, respectively. The band at 2934 cm-1 is assigned to C–H symmetric stretching in pendant methyl groups in proteins (i.e., amino acid side chains). Taking the peak intensity ratio of the bands at 2848–2934 cm-1 allows for the calculation of the level of lipid rela- tive to protein present in the sample. The bands at 1080 and 1125 cm-1 are due to C–C skeletal stretching in lipids. The peak intensity ratio of 1125 to 1080 cm-1 provides an indicator of lipid conformation order in the sample. For better illustration, Figure 12C contains three spectra obtained from various depths within the fi ber (cuticle, cortex, and medulla) in the 1200–1750 cm-1 region. An amide Figure 11. FT-IR image and representative spectra illustrating beta sheet distribution in virgin and thermally treated hair. The FTIR image was generated from the peak intensity ratio of 1516 to 1548 cm-1 obtained from the spectra gathered for each pixel. The representative spectra were obtained from European dark brown hair.

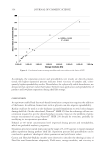
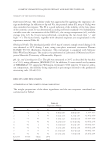
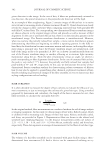
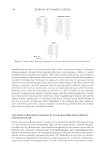
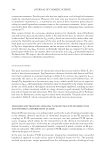
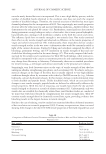
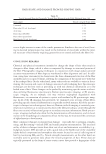
HAIR SHAPE AND DAMAGE FROM RE-SHAPING HAIR 395 I band is present in the 1500–1720 cm-1 region and its frequency depends on the type of protein secondary structure. The band at 1668 cm-1 corresponds to beta sheet conformation. The width of this peak varies with depth in the fi ber, being broader in the cuticle and sharper in the cortex. The band at 1685 cm-1 is associated with disordered protein structure. The level of disulfi de bonds can be monitored utilizing the peak data of the band at 509 cm-1, which is due to S–S stretching. The relative amount of disulfi de bond is calculated by taking the peak area ratio of 509 to 1448 cm-1 (due to C–H scissoring in CH2 and CH3 moieties) (25). MONITORING THERMAL DAMAGE IN HAIR WITH RAMAN CONFOCAL IMAGING Similar to FT-IR spectroscopic imaging, one may generate distribution maps of specifi c molecular species in a specimen with Raman confocal imaging. In addition to follow- ing changes in protein structure, the level of lipids and their degree of order can be Figure 12. Raman spectra of untreated non-pigmented white hair. Spectra in (A) and (B) were obtained by depth profi ling beginning at the surface of hair with the lower most spectrum and ending in the interior of the fi ber with the uppermost spectrum. See text for peak assignments. The three spectra in (C) were obtained at various depths in the fi ber and demonstrate a change in the shape of the amide band at 1668 cm-1 indicative of higher levels of beta conformation in the cuticular region. Originally published in Reference 25. Reprinted with permission of the Society of Photo Optical Instrumentation Engineers, Copyright 2011.
Purchased for the exclusive use of nofirst nolast (unknown)
From: SCC Media Library & Resource Center (library.scconline.org)