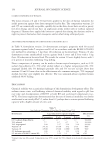
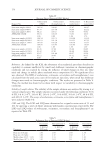
118 JOURNAL OF COSMETIC SCIENCE FTIR SPECTROSCOPY The Nicolet™ iS50 (Thermo Fisher Scientific, Waltham, MA, United States) was used to get the FTIR spectra. The measurements took place at the room temperature in the wavelength range of 0–4,000 cm−1. PORE STRUCTURE STUDIES The pore structures of the BPO microsponges were determined by using nitrogen gas adsorption (Micromeritics 3 Flex, Micromeritics, Norcross, GA, United States). The adsorption analysis was conducted under 765 mmHg pressure. The surface area and pore diameter were calculated using the Brunauer-Emmett-Teller surface area analysis model, and the pore volume was calculated using the Barrett-Joyner-Halenda pore size analysis model. Prior to the analysis, the sample was kept under the low pressure at the degas unit for 12 hours at 30 °C. IN VITRO DRUG RELEASE OF BPO-LOADED MICROSPONGES To determine in vitro drug release profiles of the microsponges, 0.05 g of BPO-loaded microsponge was suspended in glass vessels containing 200 mL phosphate buffer solution (pH 7.4): acetone (4:1) and incubated on a shaking bath at 37 °C, 70 rpm. At the appropriate time intervals, samples were withdrawn, and the released BPO amount was determined by a validated UPLC method. Sink conditions were maintained in the receptor compartment during in vitro release studies (n = 3). APPLICATION OF BPO MICROSPONGES ONTO TEXTILE MATERIALS BPO microsponges were applied onto cotton fabric by using a spraying technique with 102% wet pickup. The solution, for which content ratios are given in Table I, was prepared and applied onto textile material with a manual spraying tool. Acrylic binder was used in the solution as a crosslinking agent. HPMC is a nonirritant and nontoxic polymer, widely used in oral and topical pharmaceutical formulations (27). HPMC can be used in textiles as binders (28). In this study, HPMC was used to keep the particles at a large size on the fabric surface, which the crosslinking agent does not hold. After the treatment, the fabric samples were dried and exposed to a fixation process for 20 minutes at 65˚C. The treated cotton fabric samples were combined with adhesive tapes. Table I Content Ratios of Spraying Solution Content Amount BPO microsponges 50 g/L Acrylic binder 40 g/L HPMC 3 g/L Water L

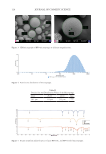
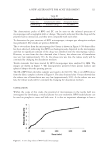
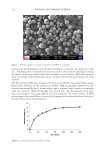
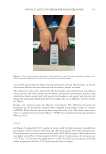
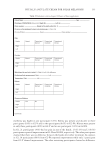
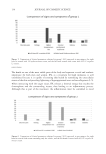
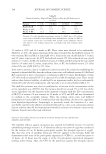
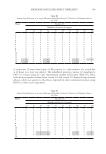
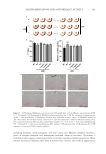
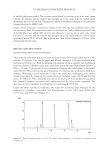
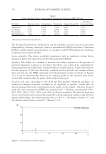
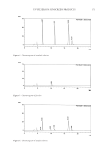
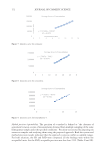
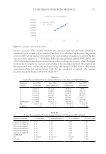
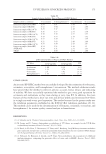
119 A New Alternative for Acne Treatment EE OF THE TEXTILE MATERIALS TREATED WITH BPO MICROSPONGES To determine the EE and DL, fabric samples (4 cm x 4 cm) were dissolved in 50 mL acetone at 200 rpm for 48 hours. To determine the amount of active substance loaded in the fabric samples, the solution was filtered through a 0.22 µm syringe filter, and filtrate was analyzed by a validated UPLC method. Each batch was evaluated five times. The EE was determined by using Eq. 4: EE% Experimental drug content Theoretical drug content = ×100 (4) IN VITRO DRUG RELEASE OF THE TEXTILE MATERIALS TREATED WITH BPO MICROSPONGES To determine in vitro drug release profiles of the textile materials treated with BPO microsponges, fabric samples (4 cm x 4 cm) were placed in glass vessels containing 100 mL of phosphate buffer solution+acetone (4:1) solution at 37 °C and 70 rpm. At appropriate time intervals, samples were withdrawn, and the amount of BPO released was determined by a validated UPLC method. The experiment was carried out three times. RESULTS AND DISCUSSION Microsponges were successfully obtained by the quasi emulsion solvent diffusion method. A validated UPLC method was used to measure the concentration of BPO from micro- sponges. The UPLC method was developed and validated following the International Council for Harmonisation of Technical Requirements for Pharmaceuticals for Human Use guide- lines’ recommendations (Q2) for validation of analytical procedures (24). The method showed that BPO peaked at 3.67 minutes, and the chromatogram is shown in Figure 2. BPO was successfully separated from other compounds. The calibration curve of BPO was linear in the concentration range of 0.5–10 µg/mL (r2 = 0.9996). The limit of detection and the limit of quantification of BPO were found to be 0.242 and 0.403 µg/mL, respectively (24). The EE and DL of BPO were as high as 60.879% and 38.929%, respectively. Considering the high EE, it can be concluded that this method is a simple and suitable technique for producing BPO-loaded microsponges. The morphology of the microsponges were investigated by SEM analysis. It was seen that the microsponges were uniform and had a spherical shape. The presence of surface pores could be clearly observed. The SEM images of the optimized microsponge formulation are shown in Figure 3. The particle size and distribution analysis were performed, and the particle size (Dv50) of the selected formulation was found to be 111 µm with a 2.567 span value. Dv50, defined as the median particle size by volume, is the particle diameter of 50% of the sample volume. A particle size distribution graph is shown in Figure 4, and the values are given in Table II. The FTIR patterns were evaluated in order to understand whether there were any interactions between the drug and the polymer. The FTIR patterns of BPO, EC, and BPO microsponges are shown in Figure 5.
Purchased for the exclusive use of nofirst nolast (unknown)
From: SCC Media Library & Resource Center (library.scconline.org)