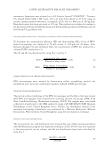
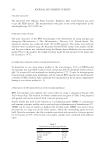
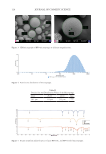
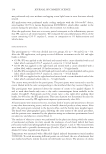
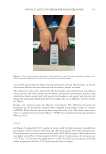
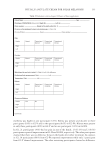
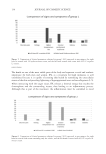
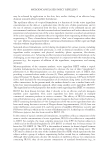
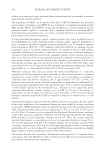
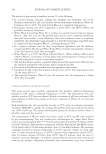
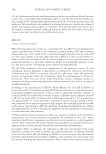
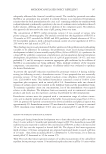
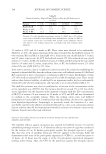
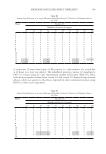
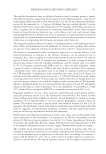
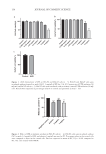
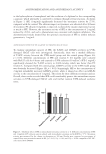
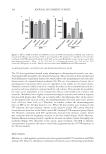
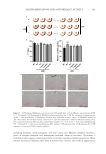
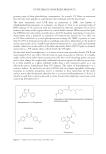
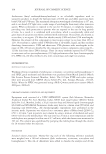
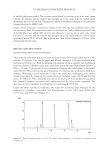
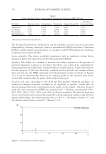
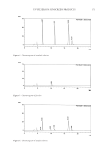
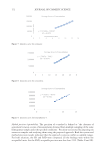
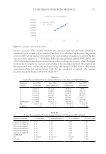
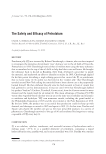
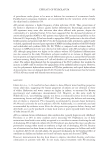
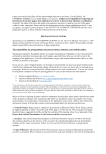
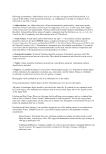
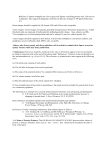
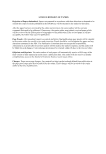
170 JOURNAL OF COSMETIC SCIENCE ANALYTICAL METHOD VALIDATION The developed method was validated for system suitability, recovery (accuracy), precision (repeatability), linearity, sensitivity (limit of quantification [LOQ] and limit of detection [LOD]), sample stability and robustness in accordance with ICH guidelines for validation of analytical procedures Q2 (R1). System suitability. The system suitability parameters such as resolution, tailing factor, theoretical plates and capacity factor (K’) were performed (Table I). Specificity. The ability of a method to measure the analyte response in the presence of potential impurities is known as specificity. Specificity was evaluated by comparing the chromatograms each of the blank, standard solution, sample solution, and placebo solution. For this purpose, 20 µL from the blank, standard solution, placebo and sample solution were injected into the HPLC separately and chromatogram results are shown in Figures 3–6. It can be observed that there are no coeluting peaks at the retention time of the actives. This indicates that the peaks of the analytes were pure. Linearity and range. According to the ICH Q2 (R1) method validation guideline, an analytical technique’s linearity is defined as its capability to produce “results that are directly proportional to the concentration of the analyte in the sample”. Linearity between peak area and concentration (PPM) was analyzed with 7 different concentrations (70%, 80%, 90%, 100%, 110%, 120%, and 130%) of all four standards. The data for peak area versus concentration were statistically analyzed by doing regression analysis using the least squares methodology. In a linear regression line y = mx + c, the slope is constant “m,” and the ordinate intersection is constant “c”(Figures 7–10). Table I System Suitability Data for the Standard Solution of the Proposed HPLC Method UV filter Retention time Tailing factor Resolution Capacity factor (K’) Number of theoretical plates Avobenzone 17.9 1.404 2.403 3.887 15319 Octinoxate 16.61 1.062 11.995 3.535 18110 Octocrylene 11.37 1.091 14.278 2.103 14281 Benzophenone-3 6.82 1.167 12.795 0.863 11372 Figure 3. Chromatogram of blank solution.

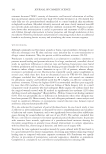
171 UV FILTERS IN SUNSCREEN PRODUCTS Figure 4. Chromatogram of standard solution. Figure 5. Chromatogram of placebo. Figure 6. Chromatogram of sample solution.
Purchased for the exclusive use of nofirst nolast (unknown)
From: SCC Media Library & Resource Center (library.scconline.org)