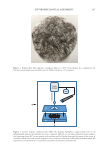
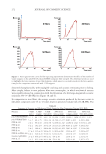
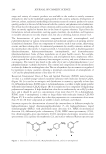
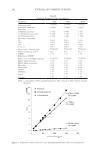
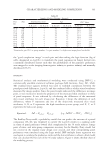
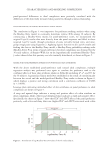
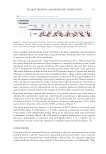
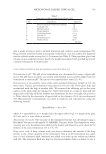
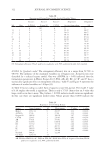
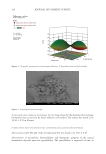
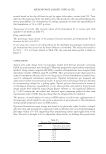
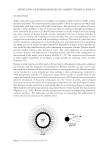
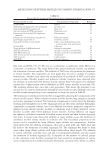
299 Characterizing and Modeling Complexion to describe skin translucency, with 0 being extremely translucent and 9 being severely not translucent. The corresponding facial skin color was measured on the cheeks using a portable X-Rite Spectrophotometer (X-Rite, Grand Rapids, MI, USA) and reported as the individual typology angle (ITA°). SKIN IMAGE CAPTURE AND VISUAL ATTRIBUTE ANALYSIS VISIA-CR (Canfield Scientific Inc., Parsippany, NJ, USA) was used to capture facial images under various lighting modalities from each of the 36 subjects. Each image contained a standard color chip to enable post-capture color correction of images. ImageJ, a freeware developed by the National Institute of Health (Bethesda, Maryland, USA), was employed to perform image analysis using our in-house–developed facial-feature-detection algorithms. The front-view images were used in this study, and a large region of interest (ROI) (including cheeks, nose, and lower periorbital region) was automatically detected and cropped out of each image. Multiple visual attributes of skin including color properties, shine, surface smoothness (32), subsurface light reflection (33,34), and spot severity were measured. Table I shows a summary of the objectively measured skin parameters, and Figure 1 shows a sample ROI and some examples of the detected skin visual attributes. PANEL PERCEPTION AND RESPONSES QUANTIFICATION A panel study on ideal complexion was conducted in a two-stimuli alternative forced choice (2-ACF) fashion. The translucency scores of the 36 study subjects were used to guide the selection of image pairs for the panel study. Paired images of masked face (as that in Figure 1B) were shown to the panel, and the Thurstonian model framework was followed (35). Specifically, images of the 36 subjects were divided into six groups with each group having three subjects with relatively high translucency scores (Table II: A, B, and C) and three with low scores (Table II: X, Y, and Z). To establish a starting point for this study, pairs of images of a high and a low score in skin translucency were formed in each group, with their age and skin ITA° values roughly balanced in each pair to avoid panelists’ simple decisions based on obvious cues of age or skin color. To further minimize perceptual bias, Table I List of Objectively Measured Visually Perceivable Parameters of Skin Parameters Description L* Brightness of CIE-LAB color space a* Redness of CIE-LAB color space b* Yellowness of CIE-LAB color space ITA° Individual typology angle indicating skin tone lightness, ITA° ={arctan(L* − 50)/b*} × 180/π HUE The hue of skin color, which is a balance between redness and yellowness, HUE =arctan(b*/a*) CUE Unevenness of skin tone (variance of grayscale pixel intensity) daStar Contrast of red spots and the normal skin (mean intensity difference between normal and spot pixels) dbStar Contrast of dark spots and the normal skin (mean intensity difference between normal and spot pixels) dINT Contrast of bright pixels and the normal skin DRR Skin subsurface reflection SVS Skin visual smoothness

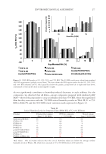
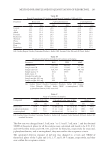
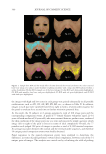
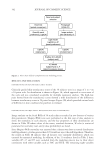
300 JOURNAL OF COSMETIC SCIENCE the images with high and low scores in each group were paired exhaustedly in all possible combinations, such as AX, AY, AZ, BX, BY, BZ, etc., as shown in Table II. In addition, images in each pair were switched from left to right to form a reversed-order sequence for the panel to evaluate for a second time to further minimize potential bias. As the result, the 36 subjects in 6 groups generated a total of 108 image pairs and the corresponding comparison events. A panel of 77 female Chinese volunteers (aged 21–64 years old with median of 38 years old), who were seasoned skincare product users, evaluated the skin conditions of the image pairs one at a time and answered a simple question: which image (left or right of the pair) is better in terms of ideal complexion? Overall, the 77 panelists each judged 108 pairs of images to produce a total of 8,316 binomial responses. An average was taken between the normal and the reversed-order sequences, and therefore 54 unique paired-comparison events were finally obtained. Panel responses to the paired-comparison events were analyzed to determine the difference, in terms of panel preference toward ideal complexion, between each of the 54 unique pairs of images. The analysis was carried out by calculating the odds of picking Figure 1. Sample skin ROI and the visual effect of some detected skin visual attributes: (A) color-corrected front-view image of a subject under Standard 2 lighting modality with a large skin ROI outlined within a yellow borderline (B) skin ROI cropped out of the facial image (C) skin ROI with shine pixels highlighted (D) ROI with wrinkles, fine lines, and pores highlighted (E) ROI with red spots highlighted and (F) ROI with dark spots highlighted.
Purchased for the exclusive use of nofirst nolast (unknown)
From: SCC Media Library & Resource Center (library.scconline.org)