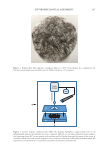
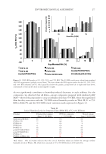
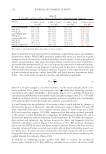
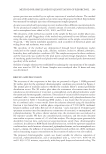
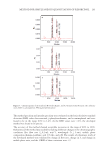
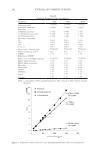
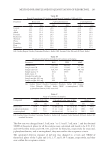
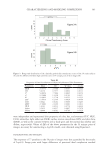
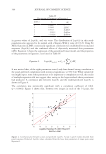
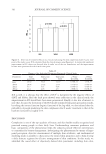
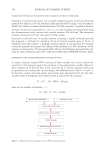
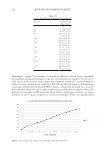
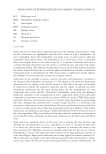
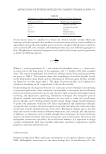
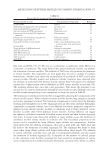
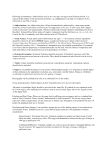
320 JOURNAL OF COSMETIC SCIENCE properly. The solution was passed through the filter paper and filtered with the mixer then measured absorbance by using a spectrophotometer at 235 nm (12). DRUG CONTENT SAMPLE ABSORBANCE STANDARD ABSORBANCE =×100 IN VITRO DRUG RELEASE STUDIES FOR MICROSPONGES LOADED TOPICAL GEL The dialysis membrane was used in Franz diffusion cell (19). The formulation containing benzoyl peroxide–loaded PLGA (microsponges) was applied on the dialysis membrane and then fixed in between the donor and receptor compartment of the diffusion cell. The receptor compartment contained phosphate buffer (100 mL) with a pH of 5.5. The diffusion medium temperature was thermostatically controlled at 37° ± 1° by surrounding water in jacket, and the medium was stirred at 500 rpm by a magnetic stirrer (20). The samples were withdrawn at predetermined intervals and replaced by an equal volume of fresh fluid. The samples withdrawn were spectrophotometrically estimated at 235 nm against their respective blank (21). RESULTS AND DISCUSSION DETERMINATION OF SOLUBILITY PROFILE Solubility of the benzoyl peroxide drug was found to be poorly soluble in water and slightly soluble in ethanol, methanol, and acetone (10). CALIBRATION CURVE Benzoyl peroxide is a topical antibiotic used in the treatment for acne vulgaris. The proposed analytical method was found to be simple and accurate for the estimation of benzoyl peroxide. The drug samples were analyzed by ultraviolet spectroscopy (235 nm) using methanol as a solvent. We concluded that the suggested method showed high linearity in organic solvent as shown in Table II and Figure 2. Moreover, this was found to be a precise and inexpensive method that can be employed for the routine quality control of benzoyl peroxide in pharmaceutical formulations (12). EVALUATION OF MICROSPONGE INCORPORATED BENZOYL PEROXIDE Experimental design and optimization of formulation. In total, 14 formulations were designed based on a CCD and characterized for entrapment efficiency and in vitro drug release. Entrapment efficiency was carried out for all the developed formulations and, based on the run, the formulation containing the highest entrapment efficiency was selected for further studies. The in vitro drug release of the developed microsponge incorporated benzoyl peroxide formulation was carried out by a diffusion method (33). Among all the developed formulations with CCD design, formulation containing PLGA and drug (benzoyl peroxide) F1 showed a sustained drug release of 50.42 in 8 hours when compared with other formulations. Entrapment efficiency (EE) and in vitro drug release (24) is shown in Table III.

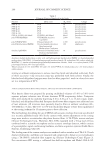
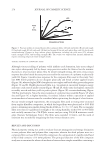
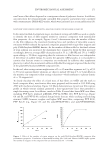
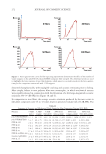
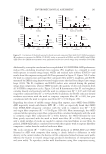
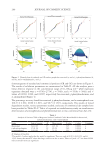
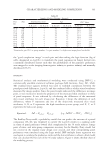
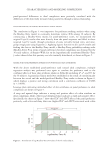
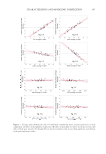
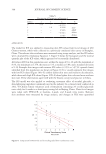
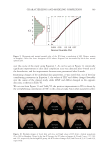
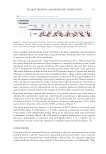
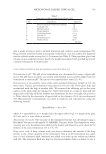
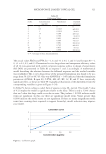
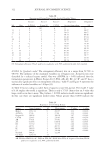
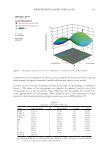
321 Microsponge Loaded Topical Gel The actual values PLGA and PVA for −1, 0, and +1 is 0.5, 1, and 1.5 and for span 80 −1, 0, +1 is 0.1, 0.2, and 0.3. Determined in vitro drug release and entrapment efficiency values of all 14 runs generated with central composite response surface in design of experiments (RS DOE) are presented in Table III as response 1 and 2 accordingly. A mathematical model describing the relations between the followed responses and the studied variables was established. The in vitro drug release of the prepared formulation was found to be in a range from 50.42% to 98.74%. One-way ANOVA (p =0.05) indicated that the formulation parameters A-PLGA, B-span 80, C-PVA, AB, AC, BC, A2, B2 and C2 have statistically significant effect, as shown in Table IV. A graphical illustration of the dependence from the corresponding variables is given in Figure 3 (34). In Table IV, factor coding is coded. Sum of squares is type III– partial. The model F value of 4.32 implies the model is significant relative to the noise. There is only a 3.50% chance that an F value this large could occur due to noise. The p values 0.0500 indicate model terms are significant. In this case there are significant model terms. Values greater than 0.1000 indicate the model terms are not significant. If there are many insignificant model terms (not counting those required to support hierarchy), model reduction may improve your model. Table II Calibration Valuea S. No. Concentration (µg/ml) Absorbance Standard deviation 1. 0 0 0 2. 0.5 0.1023 ±0.001 3. 1 0.2012 ±0.001 4. 1.5 0.288 ±0.012 5. 2 0.386 ±0.0011 6. 2.5 0.491 ±0.001 7. 3 0.586 ±0.012 8. 3.5 0.681 ±0.0012 9. 4 0.765 ±0.001 10. 4.5 0.855 ±0.012 11. 5 0.999 ±0.0011 a n =3 (average of three determinations). Figure 2. Calibration graph.
Purchased for the exclusive use of nofirst nolast (unknown)
From: SCC Media Library & Resource Center (library.scconline.org)