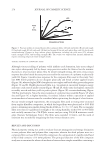
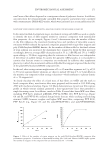
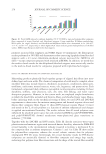
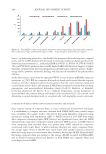
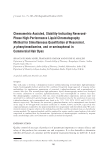
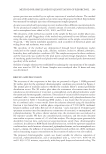
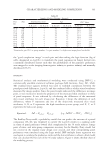
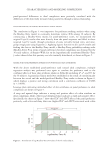
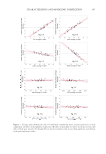
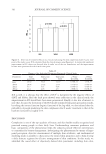
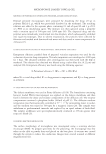
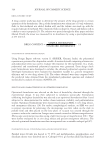
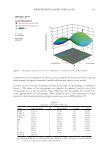
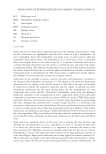
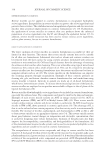
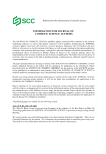
307 Characterizing and Modeling Complexion Figure 7. Leverage plots showing the effect of individual contributing factor on panel preference to ideal complexion: (A) effect of the lightness of skin tone (B) effect of skin shine (C) effect of red spot severity (D) effect of dark spot severity (E) through (H) are for skin attributes that do not show significant contribution to the panel-preference ranks.

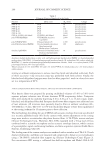
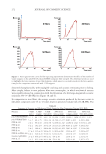
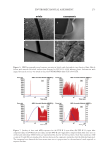
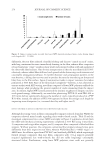
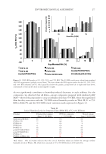
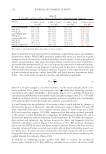
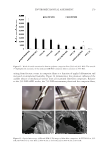
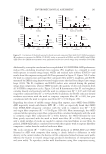
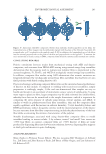
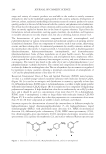
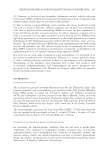
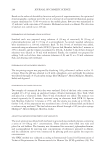
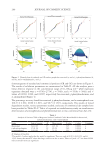
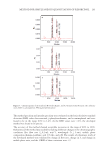
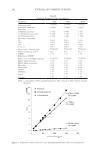
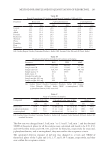
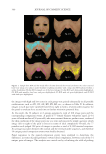
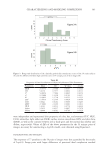
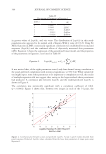
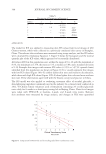
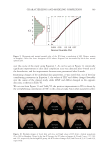
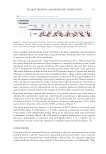
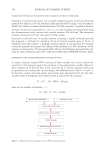
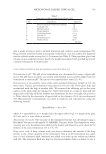
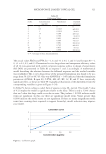
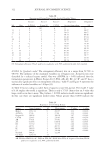
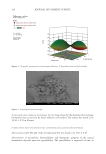
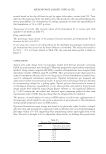
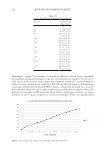
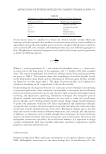
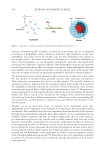
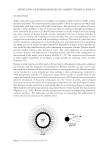
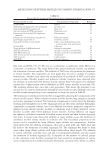
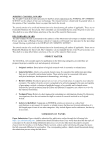
308 JOURNAL OF COSMETIC SCIENCE APPLICATION The model for ICS was applied to measuring skin ICS values from facial images of 480 Chinese women, which were collected in a previously conducted skin survey in Shanghai, China. The relevant skin attributes were measured using image analysis, and the ICS values were calculated by employing Equation 3. Figure 9 shows the histogram and the normal quantile plot of the ICS values, which appeared to be normally distributed. All values of ICS in this population were within the range of 0 to 10 with the maximum at 8.751, the minimum at 1.579, the mean at 5.75, a median at 5.88, and a standard deviation of 1.29. Example skin images with extreme ICS values (2.5% or 97.5% quantile limit) identified from this population are shown in Figure 10. It is visually apparent that images with low ICS values (Figure 10A–C) exhibit darker skin tone and extensive discoloration, while those with high ICS values (Figure 10D–F) show lighter skin color and more uniform skin tone. These observations agree well with the beauty concept and practice in China. The ICS model was also applied to evaluating treatment effect of ascorbyl glucoside, a skin-lightening ingredient commonly used in the industry. In a clinical study conducted in 2012, 45 Chinese female volunteers used a formulation containing 2% ascorbyl glucoside twice daily for 8 weeks in a third-party testing lab in Beijing, China. Their facial images were taken with VISIA-CR at baseline, 4-week, and 8-week time points. Relevant skin attributes were measured by image analysis, and changes in ICSs were quantified Table V Description of Parameters in Equation 3 Index, i a b Ci Pi 0 13.5 – −8.2233 – 1 – 1.8 0.2028 ITA° 2 – – 0.5065 dINT 3 – – −0.5913 daStar 4 – – −3.0467 dbStar Figure 8. Comparison between ICS and clinically graded skin translucency scores.
Purchased for the exclusive use of nofirst nolast (unknown)
From: SCC Media Library & Resource Center (library.scconline.org)