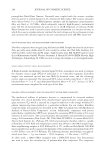
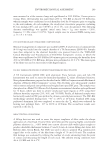
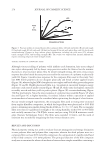
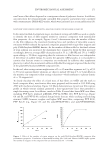
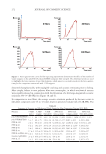
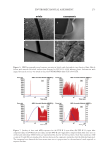
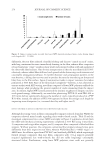
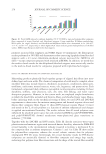
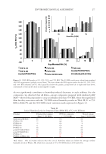
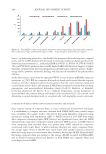
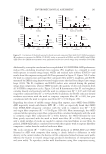
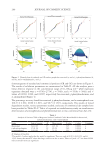
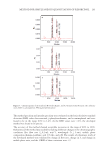
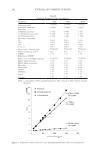
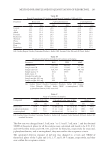
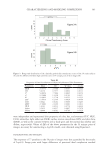
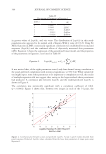
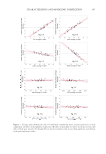
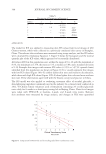
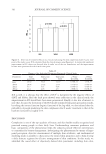
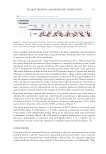
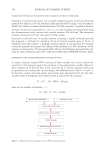
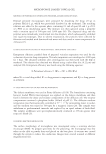
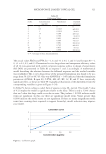
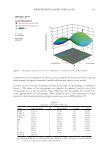
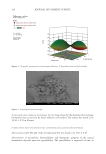
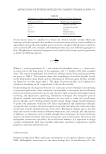
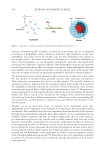
305 Characterizing and Modeling Complexion panel-perceived differences in ideal complexion were positively correlated with the differences of the objectively measured skin parameters through a linear relationship. PANEL PREFERENCE RANKING BY BRADLEY–TERRY MODEL The correlation in Figure 4 was imperative for preference-ranking analysis when using the Bradley–Terry model to eventually determine relative ICSs among 36 subjects. By constructing a Bradley–Terry matrix for panel-preference scores, we incorporated the original Logit(A) results that were directly from the panel responses and filled in those required Logit(A) results through simulation of some virtually formed intra- and inter- group image pairs using Equation 2. Applying logistic function to all Logit(A) results and feeding the data to the Bradley–Terry model, a Bradley–Terry probability ranking order (Bradley–Terry P) in terms of panel preferences for ideal complexion was obtained for the 36 study subjects. A Shapiro–Wilk test on the logarithmically transformed Bradley–Terry p values showed that this quantity was also normally distributed, as shown in Figure 5. MODEL FOR PANEL PREFERENCE PREDICTION WITH BASIC SKIN ATTRIBUTES With the above established panel-preference rank toward ideal complexion, multiple regression analysis was performed once again to correlate the preference rank to the combined effects of basic skin attributes shown in Table III (excluding L*, a*, and b*) for the 36 subjects. A generalized linear model was established as the result. A correlation plot between the actual and the model-predicted Bradley–Terry ranks is shown in Figure 6, which displays a positive and strong correlation with a correlation coefficient of 0.9866 (p 0.0001). Leverage plots indicating individual effect of skin attributes on panel preference to ideal complexion are shown in Figure 7. A steep and upward slope indicates a strong and positive effect of a skin attribute on ideal complexion, while a flatter and downward slope indicates a mild and negative effect. Specifically, the charts in Figure 7 show that ITA° and dINT affected the panel preference positively, with a fair and shiny skin tone (higher ITA° and dINT) associated with a skin Figure 5. Distribution of log (Bradley–Terry P) values of the 36 study subjects.

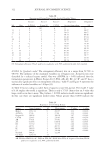
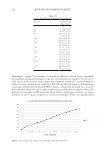
306 JOURNAL OF COSMETIC SCIENCE condition that was closer to the ideal complexion. Pigmentary spots (higher daStar and dbStar), on the other hand, affected panel preference negatively, with more visible dark spots leading to a skin condition deviating further from the ideal complexion. Skin attributes of SVS, CUE, DRR, and HUE contributed to the complexion-preference model minimally without high enough statistical significance, as shown in Figure 7E–H. By scaling the linear model of Figure 6 to a consumer-relevant scale of 0 to 10 and defining it as ICS, a final model was obtained, as shown by Equation 3, which can predict the ICS of a person’s skin based on the objectively measured skin attributes. The properties of the coefficients a, b, C i ,and parameters P i in Equation 3 are listed in Table V. Since the ICS was defined as the relative preference to ideal complexion between two images in a pair, higher values of ICS indicated a skin with conditions that were closer to that of ideal complexion. Equation ICS a C C P b i i i 3. 0 =++=1 Σ4 COMPARISON BETWEEN ICS AND CLINICAL TRANSLUCENCY SCORE Comparing ICS scores with the clinically graded skin translucency scores of the 36 subjects, we observed some similarities. Skins with high ICS scores were generally more translucent, and vice versa, as shown by the correlation plot in Figure 8. This result may have been driven by the pursuit of lighter skin tone in Asian culture, causing the two parameters to overlap. However, since the defining parameters and the mechanisms of synthesizing each parameter were different, they reflect different properties of skin, translucency, and complexion. Figure 6. Correlation plot between actual and predicted Bradley–Terry Probability Ranks, which reflected the relative levels of panel preference to ideal complexion among study subjects. Actual: Bradley–Terry Ranks obtained from transformation of Logit(A) values. Predicted: Bradley–Terry Ranks calculated from the combined effects of basic skin parameters of study subjects.
Purchased for the exclusive use of nofirst nolast (unknown)
From: SCC Media Library & Resource Center (library.scconline.org)