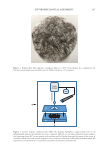
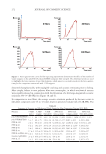
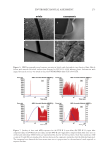
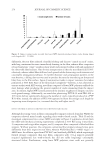
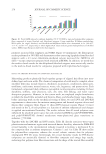
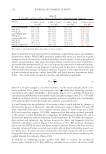
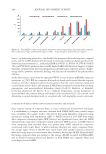
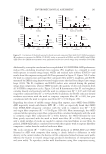
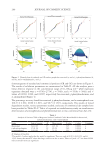
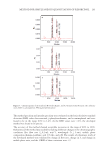
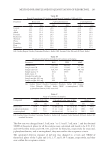
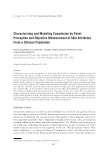
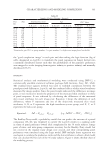
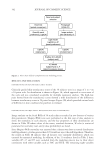
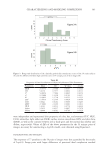
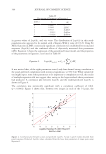
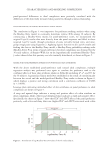
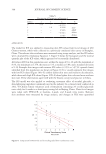
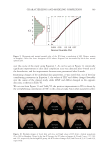
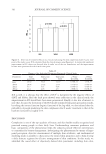
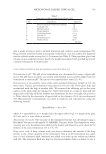
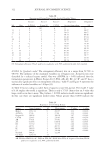
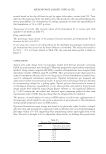
309 Characterizing and Modeling Complexion over the course of the study using Equation 3. As can be seen in Figure 11, statistically significant improvement in skin ideal complexion score was detected after 4-week use of the formulation, and the improvement became more pronounced after 8 weeks. Examining changes of the individual skin parameters, it was noted that, out of the four contributing parameters in Equation 3, the values of ITA° and daStar changed favorably over the course of the clinical study, while dINT and dbStar changed in the opposite direction, as shown in Table VI. We can see from Figure 11 and Table VI, the positive improvement in ICS is driven by the overwhelming contribution of ITA° in this clinical study. Since other parameters affect Figure 9. Histogram and normal quantile plot of the ICS from a population of 480 Chinese women in Shanghai, China. Bar chart: histogram of ICS values. Diagonal line surrounded by black dots: normal quantile plot. Figure 10. Example images of facial skin with low and high values of ICS from a female population (N =480) in Shanghai, China. In the low ICS group, the ICS values of images A, B, and C were 2.37, 2.96, and 2.52, respectively. In the high ICS group, the ICS values of images D, E, and F were 8.33, 8.75, and 8.39, respectively.

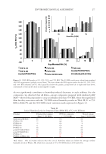
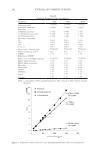
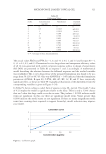
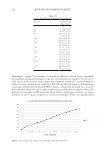
310 JOURNAL OF COSMETIC SCIENCE ICS as well, it is obvious that the effect of ITA° is dampened by the negative effects of dINT and dbStar. Had the dark spots showed more reduction in the clinical study, the improvement in ICS would have been more pronounced. Finally, it also was of interest to note that, because the derivation of the ICS model stemmed from panel-perception results, by taking the inverse function (logistic function) of the log-odds, we also inferred that the probability of people preferring the skin complexion after 8 weeks’ treatment to that of the baseline increased by roughly 27%. DISCUSSION Complexion is one of the top qualities of beauty and skin health readily recognized and perceived among people in their daily lives. Understanding consumer preference and basic components of the phenomenon helps the industry provide effective interventions to consumers for beauty management. Investigating the phenomenon by means of large- panel perception, objective measurement of multiple skin attributes, and mathematical modeling made it possible to characterize the desired skin properties and to help develop a daily skincare regimen for effective management of skin conditions. In this study, we identified the causal effect of objectively derived skin parameters including skin color, Figure 11. Detection of treatment efficacy in a clinical study using the ideal complexion model. X-axis: time point of the study y-axis: ICSs calculated from the clinical images using Equation 3. A statistically significant improvement in ICS values was detected after 4 weeks’ use of the test formulation, and the improvement became more pronounced at the 8-week time point. Table VI Changes of the Individual Parameters During the Clinical Study Parameters Time point BSL Time point W04 Time point W08 p Value W04/BSL p Value W08/BSL ITA° 26.82 30.21 42.19 6.38E-14 1.33E-37 dINT 28.06 27.92 27.31 5.34E-01 5.76E-03 daStar 5.17 5.15 4.96 8.34E-01 4.70E-02 dbStar 4.14 4.18 4.37 2.86E-01 8.23E-07
Purchased for the exclusive use of nofirst nolast (unknown)
From: SCC Media Library & Resource Center (library.scconline.org)