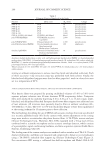
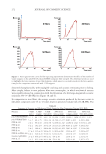
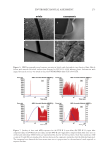
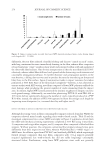
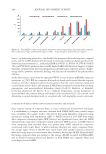
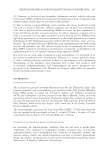
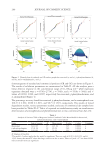
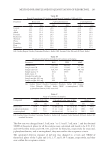
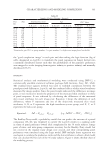
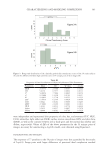
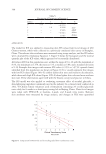
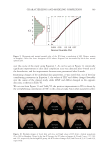
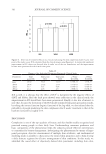
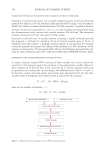
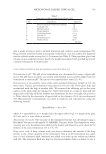
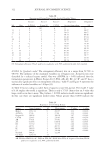
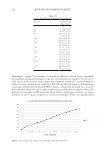
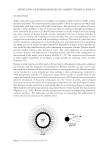
303 Characterizing and Modeling Complexion were independent and represented skin properties of color, hue, and evenness (ITA°, HUE, CUE) subsurface light reflection (DRR) surface texture smoothness (SVS) and skin shine (dINT), as well as the contrast between red or dark spots and the normal skin (daStar and dbStar, respectively). Values of ΔPs of the above parameters for the 54 unique pairs of images, necessary for constructing a Logit(A) model, were obtained using Equation 1. PANEL RESPONSES AND MODELING The responses of 77 panelists to the 54 pairs of images were first quantified by the results of Logit(A). Image pairs with larger differences of perceived ideal complexion resulted Figure 3. Range and distribution of the clinically graded skin translucency scores of the 36 study subjects (A) and the difference between high and low scores in 54 unique pairs of skin images (B). Table III Properties of Data Distributions of Objectively Measured Skin Parameters Parameters Mean SD W value p value DRR 23.4371 2.3488 0.9497 0.1020 SVS 5.6430 0.7577 0.9802 0.8114 L* 54.8954 2.2996 0.9865 0.9376 a* 12.2484 1.1128 0.9761 0.6137 b* 19.9842 1.3718 0.9553 0.1532 ITA° 13.6615 6.2456 0.9828 0.8368 CUE 0.0641 0.0102 0.9669 0.3465 dINT 27.6884 2.4299 0.9683 0.3811 HUE 1.0203 0.0534 0.9776 0.6646 daStar 5.2635 0.6537 0.9807 0.7678 dbStar 3.4000 0.4341 0.9746 0.5628

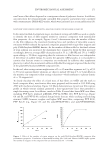
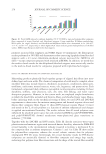
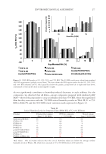
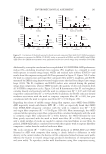
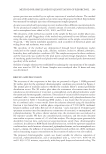
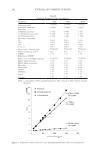
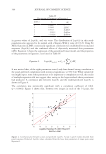
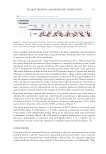
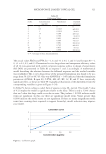
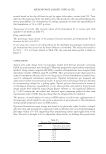
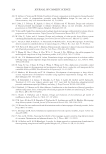
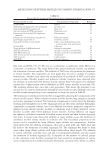
304 JOURNAL OF COSMETIC SCIENCE in greater values of Logit(A), and vice versa. The distribution of Logit(A) in this study population also appeared to be normal with a Shapiro–Wilk p value of 0.7129. Using Fit Model function in JMP, a statistically significant correlation was established between panel responses (Logit(A)) and the combined effects of objectively measured skin parameters (ΔPs). Equation 2 shows the expression of the generalized linear model, and the properties of the parameters in Equation 2 are listed in Table IV. Equation Logit(A C predicted i i i=1 2. 0 4 )=+∑C ∆P It was noticed that, of the eight parameters tested, only four showed strong correlation to the panel-preferred complexion (with statistical significance at 95% CL). While intuitively one might expect some other parameters to be important to complexion as well, the results of multiple regression did not suggest that, owing to the large residuals those parameters had produced. A correlation plot between Logit(A) and the model-predicted Logit(A) is shown in Figure 4. The correlation was statistically significant with a correlation coefficient of 0.841 (p 0.0001). Figure 4 shows that, between two images in each of the 54 pairs, the Table IV Description of Parameters in Equation 2 Index, i Ci ΔPi 0 0.5947 – 1 0.2416 ΔITA° 2 0.5624 ΔdINT 3 −0.6634 ΔdaStar 4 −3.4024 ΔdbStar Figure 4. Correlation plot between actual and predicted Logit(A). Actual: Logit(A) values obtained from panel responses. Predicted: Logit(A) values calculated from the basic skin parameters of image pairs using Equation 2.
Purchased for the exclusive use of nofirst nolast (unknown)
From: SCC Media Library & Resource Center (library.scconline.org)