HPLC ANALYSIS OF BACTERIOSTATS 165 B. Deodorant Soaps Approximately 1 g of soap was accurately weighed and transferred into a 50-ml volumetric flask. 10 ml of methanol was added and the soap was dissolved with gentle heating. The solution was diluted to volume with methanol. 5 ml of the methanolic solution was transferred to a 100-ml flask and brought to volume with 1:1 (V/V) methanol:water. The solution was thoroughly mixed and an appropriate amount of the solution was transferred to a stoppered centrifuge tube. The tube was cooled in a methanol-ice bath for 30 min and centrifuged while cold and the clear supernatant was transferred into a sample vial. This solution was used for chromatography. C. Chemical degradation of bacteriostats for "stability indicating" testing Several chemical degradation studies of the individual bacteriostats and the deodorant samples (containing bacteriostats) were carried out. The following tests were performed: 1) effect of acid 2) effect of alkali 3) effect of oxidation 4) effect of heat and 5) effect of UV irradiation. Triclosan and TCC and the deodorants were dissolved in methanol and to the methanolic solution acid (HC1), base (NaOH), oxidizing agent (Potassium monoper- sulphate, Oxone ©) were added, respectively. An aliquot of each of these solutions was transferred into an ampule and sealed. The ampules were heated at 40øC for 24-48 h. For UV irradiation the methanolic solution was applied on a clear glass plate and the solvent was evaporated in vacuum. The process was repeated several times to ensure that sufficient amounts of the sample had been added onto the glass plate. One half the glass plate was covered with aluminum foil to serve as a control and the other half was exposed to UV light. This was accomplished by placing a mercury lamp (Model //GE, G15T8) about 6 in above the glass plate. In addition, methanolic solutions of triclosan and TCC in sealed ampules were also exposed to UV light. QUANTITATION The calibration standards were injected in duplicate and a regression analysis of the drug concentration versus the area under the curve was carried out. The concentration of the bacteriostat was extrapolated from the regression curve and the percent of the bacteriostat was calculated in the following way: C -- x V x 100 = % Bacteriostat, SIV where C = extrapolated concentration of the bacteriostat in mg/ml, Sir/= sample weight in mg, V = sample volume. IDENTIFICATION OF THE BACTERIOSTATS Initial identification of the bacteriostats was carried out by comparing the retention of the bacteriostats with those of the authentic reference standards. Further confirmation

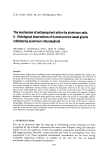
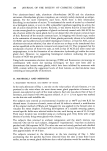
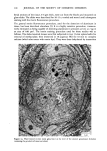
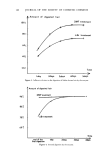
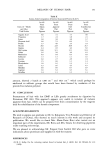
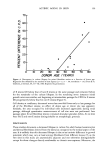
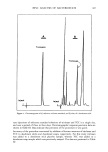
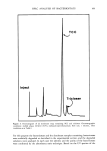
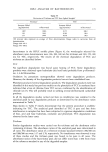
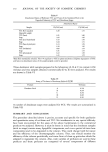
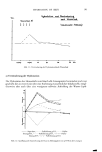
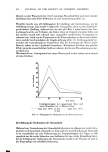
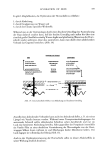
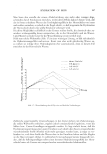
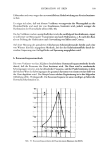
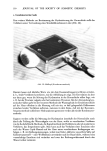
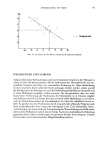
166 JOURNAL OF THE SOCIETY OF COSMETIC CHEMISTS of the identity and purity of the chromatographic peak was effected by the absorbance ratio measurement technique which is accomplished in the following way. An authentic bacteriostat standard is chromatographed and the flow of the mobile phase is stopped approximately at the chromatographic peak maximum. The instrument is programmed to measure the absorbances of the eluate at pre-selected wavelengths and the ratios of the absorbances are calculated. Similarly, a sample is chromatographed and the absorbance ratios of the analytical peak are determined. If the absorbance ratios of the bacteriostat in the sample compare within _+ 10% with those of the reference standard, the identity and the purity of the bacteriostat is confirmed. RESULTS AND DISCUSSION Under the chromatographic conditions used, triclosan and TCC showed the chroma- tographic properties listed in Table I. Table I Chromatographic Properties of Triclosan and TCC • Rentention time (sec.): 483 468 k': 6.1 5.9 H.E.T.P. (mm): 0.111 0.123 Tailing factor (%): 70 70 •Chromatographic conditions: •Bondapak alkyl phenyl column, 1:1 (V/V)Acetonitrile:water, mobile phase flow rate 2 ml/min., detection wavelength 280 nm. For calculation of tailing factor see Ref. (6). Both triclosan and TCC were tested for their linear detection range. The data were obtained using three calibration standards and each standard was injected in duplicate. The results are summarized in Table II. Table II Linearity Data of Triclosan and TCC • Amount Injected Slope Correlation Compound range 0tg) (counts, ng) Intercept Coefficient Triclosan 0.63- 1.89 467 +6600 0.99999 TCC 0.15 - 0.62 1,354 - 7800 0.99994 •Chromatographic conditions: As in Table I. For regression analysis, area under the curve was obtained in electronic counts. Chromatograms of a reference triclosan standard and that of a deodorant stick are shown in Figure 1. The chromatogram clearly demonstrates the separation of triclosan from perfumes and other ingredients. None of the deodorant sticks contained any TCC. Similarly, chromatograms showing the separation of TCC are shown in Figure 2. All of the commercial deodorant soaps except one analyzed in this study contained only TCC as shown in the product label however, both TCC and triclosan can be separated using a modified solvent system as shown in Figure 3. The precision and accuracy of the procedure were determined. The within-run and between-run precisions of the chromatographic responses were determined by repli-
Purchased for the exclusive use of nofirst nolast (unknown)
From: SCC Media Library & Resource Center (library.scconline.org)