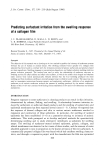
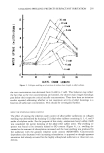
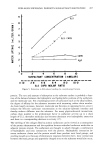
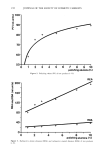
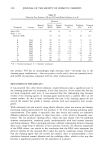
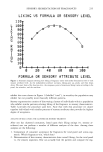
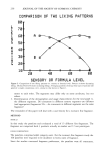
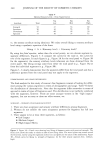
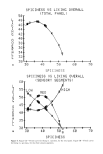
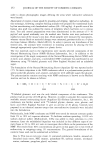
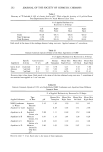
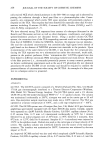
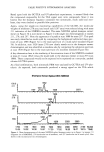
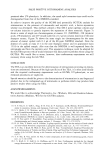
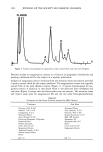
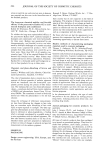
236 JOURNAL OF THE SOCIETY OF COSMETIC CHEMISTS COMPAR I SON OF TWO LI KING PATTERNS L I K I N G 88 78 58 R 40 A T I 30 N G 20 18 A B 20 48 GO 80 SENSORY OR FORMULA LEVEL Figure 2. Comparison of two liking patterns (vs. sensory or formula level). Pattern A shows decreasing liking, whereas Pattern B shows increasing liking. Averaging panelists showing these types of patterns will generate a single compromise curve, similar to that shown in Figure 1. ments to each other. The segments may differ only on some attributes, but not others. 3. Determination of the demographics and usage characteristics for the total panel vs. the different segments. Do consumers in different sensory segments use different (and appropriate) fragrances? Or--do consumers in different segments use the same fragrance? The remainder of this paper will deal with a case history for a wonnan's fine fragrance. METHOD STIMULI In this study the panelists each evaluated a total of 15 different fine fragrances. The fragrance set comprised both 3 products actually in market and 12 test prototypes. PANEL COMPOSITION The panelists comprised adult category users. For the woman's fine fragrance study the 160 panelists were required to be moderate to heavy users of fragrance. Since the studies concerned fragrance preferences, the panelists were all consumers,

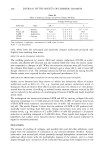
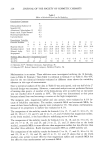
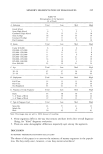
SENSORY SEGMENTATION OF FRAGRANCES 237 rather than expert panelists. All panelists were pre-recruited according to standard mar- keting research specifications (e.g., consumers of the category, not associated with a fragrance company, an advertising company, or a marketing research outfit). ATTRIBUTES AND SCALES Panelists evaluated each of the fragrances in a randomized order on a variety of scales. The scales tapped a variety of sensory characteristics, overall acceptance, and image/ quality perceptions. By instructing the panelists to rate both sensory attributes and acceptance, it became possible to relate overall liking to these attributes. (Parentheti- cally, simple liking ratings alone, without the accompanying sensory attributes, pre- vents the researcher or marketer from determining why a fragrance was accepted or rejected). The attribute scales used were 0-100 fixed point scales, anchored at both ends. The attributes appear in Table II. The anchoring eliminates ambiguity in the scale usage. The panelists easily learn and use the 100-point scale. Finally, the extended length of the scale allows for discrimination among fragrances. ACTiViTiES DURING THE EVALUATION One often hears complaints about the panelist's inability to test more than two or three fragrances without becoming fatigued. To guard against fatigue, the panelists evaluated Table I Segmentation Method Step •.' Step 2.' Step 3.' Step 4.' Step 5: Step 6.' For each attribute (e.g., sweetness), compute the mean attribute rating (e.g., mean sweetness) for every fragrance. For 12 fragrances, this gen- erates a total of 12 means. Compute the mean from the ratings of the total panel. For each panelist, relate his or her liking ratings of the fragrances tried to the attribute rating (e.g., liking vs. sweetness). Use a quadratic equation of the form: Liking = A + B(Sweemess) + C(Sweemess) 2. For each equation obtained in Step 2, calculate the attribute level at which liking is the highest. This is the optimum attribute level. Step 3 should generate a matrix. The columns of the matrix should be different sensory attributes. The rows should be the panelists (1 row per panelist). The numbers in the matrix represent the sensory at- tribute level at which the panelist reaches his/her highest liking level. Factor analyze the matrix to reduce variability. The attribute matrix should shrink to a set of uncorrelated attributes. (Use Eigenvalues greater than one to select orthogonal axes in the factor analysis.) Compute the factor scores for the panelists on this new factor matrix, after rotating the factors (e.g., by the varimax method). Cluster the panelists, based upon their factor scores. The clusters repre- sent segments of individuals with similar preference or acceptance patterns. The clustering works on individual points in the geometrical space. Points correspond to panelists. Points close together fall into the same clusters.
Purchased for the exclusive use of nofirst nolast (unknown)
From: SCC Media Library & Resource Center (library.scconline.org)