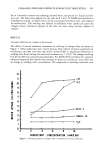
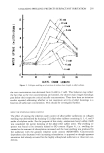
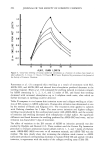
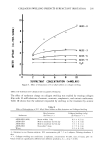
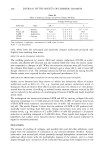
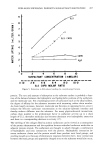
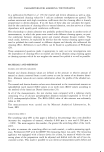
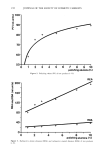
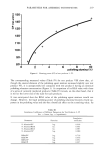
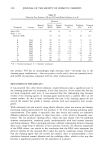
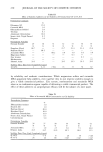
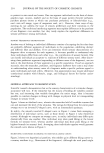
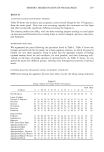
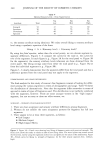
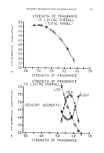
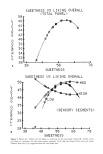
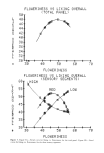
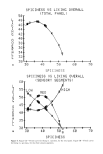
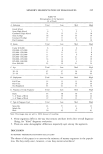
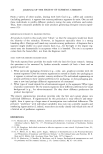
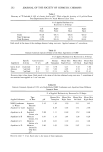
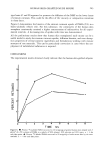
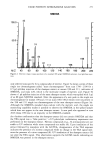
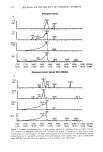
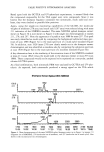
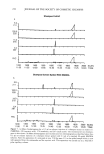
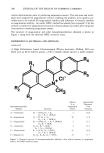
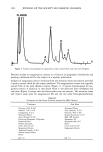
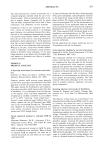
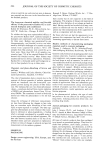
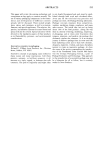
240 JOURNAL OF THE SOCIETY OF COSMETIC CHEMISTS Table V Optimal Sensory Levels--From Segmentation Seg Seg Seg Attribute Total Low Med High Strength 52 47 56 60 Sweetness 50 36 55 55 Floweriness 47 60 42 30 Spiciness 37 30 37 52 vs. the sensory attribute rating (abscissa). We relate overall liking to sensory attribute level using a quadratic equation of the form: Liking = A + B(sensory level) 4- C(sensory level) 2 By using the fitted equation, rather than the actual points, we can discern segment-to- segment differences. Figures 3-6 compare the curves for the total vs. the curves for two of the segments. In each figure (e.g., Figure 3A for the total panel vs. Figure 3B for the segments), the sensory attribute levels (abscissa) are those obtained from the entire panel. The liking ratings come from either the total panel (e.g., Figure 3A) or from the individual segments (e.g., Figure 3B). Figures 3-6 clearly demonstrate that the segments differ from the total panel and that a preference pattern from the total panel may not apply to the segments. DEMOGRAPHICS AND USAGE DIFFERENCES The final analysis for this study of women's fine fragrances consists of looking for differ- ences among the various segments in terms of demographics and usage. Table VI shows the distribution of characteristics. Note that the segments differ somewhat in terms of age and in terms of types of fragrances used. The distribution is not perfectly correlated with the segments, however. There are some younger women in the "high impact" segment, but not as many as there are older women, etc. SUMMARY--WOMEN'S FiNE FRAGRANCE STUDY 1. There are clear acceptance and sensory attribute differences among fragrances. 2. Women do not exhibit the same acceptance patterns for fragrance but fall into segments. 3. There appear to be at least three segments, as follows: ß Low Impact ß Medium Impact ß High Impact/Heavy Figure 3. Figure 3A--Fitted curve showing how liking of fragrance varies with perceived strength. The fitted curve allows the reader to obtain an idea of how liking varies. The actual points may scatter around the fitted line, but by using the regression method one can rapidly see the nature of the relationship. Figure 3B--Fitted curves for liking vs. strength of fragrance, for the three sensory segments (low, medium, high).

SENSORY SEGMENTATION OF FRAGRANCES 241 L I K I 0 L L L I K I 0 E R L L 4'_2 46 44 42 40 34 ._22 .30 ,_'-,0 55 50 45 40 35 30 3TREt.4GTH OF FRAGRANCE US L I K I NG OUERALL ,:: T 0 T 'AL PANEL , 50 •4 5 ø " _ ,_, ,:, 2 ,3,3 STRENGTH F•F FF.:RGF.:ANF:E STREI"4GTH OF FR•GRAhlCE L IK ING OUERALL • L blED ( S E [.4 S 0 R "," S E G f'l E t.4 T S ::, :-- T R E [.4 G T H I'IF 50 6,0 FRAGRANCE •I GH 70 70
Purchased for the exclusive use of nofirst nolast (unknown)
From: SCC Media Library & Resource Center (library.scconline.org)